
Last updated on October 23rd, 2024 at 04:34 pm
XIRR Vs CAGR a comprehensive guide
In this article I will share some practical examples to explain what is XIRR vs CAGR.
The decision to invest is very critical. Albert Einstein once said that compounding is the eighth wonder of the world. Now how would one measure the compounding effect? With the help of CAGR, we can calculate the average growth at which our portfolio is increasing in value during a period of time. We can also predict what the future value of today’s investment could be using the CAGR. Let’s get right into it!
What is XIRR Vs CAGR?
CAGR Basics
CAGR stands for Compound Annual Growth Rate. It is the measure of the annual growth of the investment over time with the compounding effect taken into account during the investment period. It is one of the most popular and most accurate ways to calculate the approximate returns of the assets and portfolios over time [1].
The formula of CAGR is = (Future Value of investment/ Initial Investment)^(1/ n) -1

For example, HDFC Bank stock was trading at INR 2000 in 2016 and in 2020 the stock price as appreciated to 3000. So the CAGR would be ( 3000/2000)^(1/4)-1= 10.68% CAGR. So essentially what I am saying here is that on an average my investment of INR 2000 generated an average annual return of 10.68% From 2016 to 2020.
What it Doesn’t Mean
Be careful with the last statement I made. It doesn’t mean that every year we made 10.68%. So if you change the period or the final investment, then the CAGR will change.
CAGR Example 1
Example of how to use CAGR:
Imagine you have invested $10,000 in a portfolio. The return for 3 years is outlined below [1]:
| Year | Average Returns | Portfolio value |
| 1 | 30% | $13,000 |
| 2 | 7.69% | $14,000 |
| 3 | 35.71% | $19,000 |
As you can see, the returns for every year are not constant. By using the formula, the CAGR can be calculated as follows: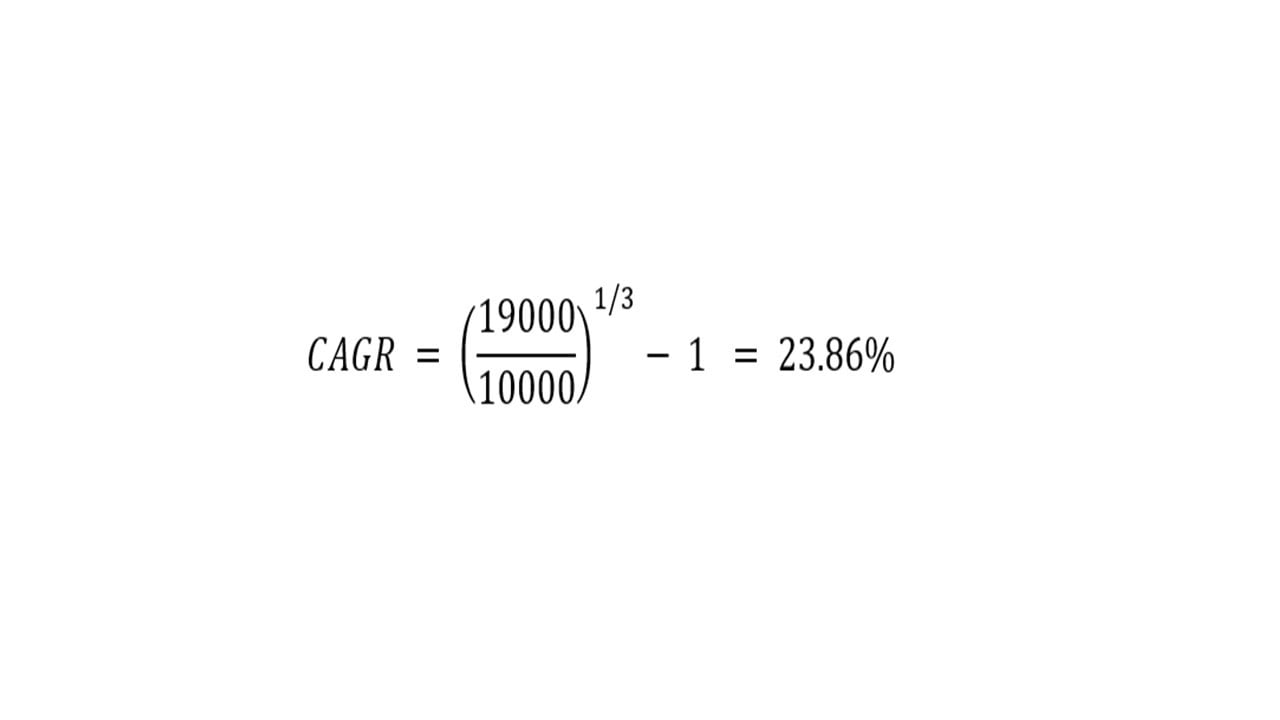
The CAGR of 23.86% over the 3-year investment can assist the investor in comparing alternatives for his capital or making forecasts of future values. Furthermore, he can even predict what his returns are going to be after a few years.
Let us look at another example where the CAGR is known to us, and we have to calculate the future value. Say, you have invested $5,000 in a stock mutual fund with an average CAGR of 26% and you want to find out your approximate returns after 10 years. According to the formula, the final value will be,

After solving this, the value of the return after 10 years will be approximately $50,428.
XIRR Basics
Similarly let’s continue with the same example above but slightly complicate the transactions. Now instead of just investing once in 2016 with INR 2000, we also investment INR 5000 IN 2017 & finally withdrew the amount in 2020 at 3500. Also the exact dates are ; 15th July 2016, 17th Aug 2017 and 31-03-2020 for redemption.
If you remember the CAGR formula, it has a serious limitation. It can only take initial investment and final investment but cannot incorporate additional cash inflows and outflows.
So we use the XIRR function in excel;

XIRR Example
So let me illustrate this point with an example;
| Year | Cashflow | Date | Cashflow | |
| 0 | -1000 | 31/03/2023 | -1000 | |
| 1 | 200 | 31/03/2024 | 200 | |
| 2 | 50 | 31/03/2025 | 50 | |
| 3 | 750 | 31/03/2026 | 750 | |
| 4 | 500 | 31/03/2027 | 500 | |
| 5 | 190 | 31/03/2028 | 190 | |
| 18.1% | 18.1% |
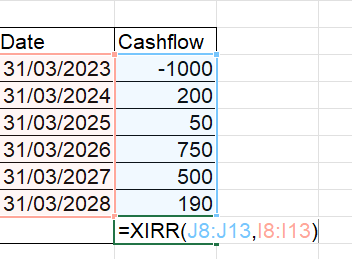
So, the IRR function, assumes that each cashflow is spread across one year. However, in case of XIRR, it can take very specific dates for calculating the returns.
The syntax for XIRR:
Difference Between XIRR Vs CAGR
So let me quickly summarise the difference between CAGR and XIRR using the same understanding that I have given you.
- CAGR is used when there is a lump sum investment and redemption happens once.
- XIRR is used when there are uneven cash inflows and outflows.
- When we use the XIRR function in case of a CAGR scenario, then XIRR & CAGR will be same.
- XIRR is an advanced extended internal rate of return concept. The difference is inclusion of actual dates.
absolute returns vs xirr
As you must have seen in both cases of XIRR & CAGR, there is a consideration of timing of cash flows. But when you do not want to account the timing of cashflows, then the returns you calculate is called absolute returns.
For example: If you invested in TITAN stock at INR 2700 in 2021 and the stock is valued at 3900 in 2024. Then the absolute return is (3900/2700)=44.4%. However rate of return xirr=13.04%.

Disadvantages of CAGR:
There are a few disadvantages of CAGR as well. The most important limitation of CAGR is that it calculates a smoothed rate of growth over a period, Hence, it ignores volatility and implies that the growth during that time was steady. Also, CAGR does not account for when an investor adds or withdraws funds from his portfolio. Another disadvantage of CAGR is that it only represents past growth, and the investor cannot assume that the CAGR will be the insame in the future as well. [3]
A third limitation of CAGR is its representation. Say that an investment fund was worth $10,000 in 2016, $7,100 in 2017, $4,400 in 2018, $8,100 in 2019, and $12,600 in 2020. In 2021, the fund manager will represent that the CAGR was a whopping 42.01% over the past 3 years but when it comes to the CAGR over the past 5 years, it is only 4.73%. [1]
Calculating CAGR without Calculator
A simple method to check how many years the value of an investment will double is to divide 74 by the rate of growth. For example, if your annual growth rate CAGR is 4% in a savings account, then 74/4= 18.5 number of years is what it will take the money to double. Similarly, if the compound annual growth rate is instead 20%, then approximately the money doubles in 3 years.
This simple mental math calculation can be very helpful while taking investment decisions.
Importance of CAGR:
CAGR is one of the most popular variables used to determine the profitability of an investment. One of CAGR’s advantages over an average rate of return is that it is not influenced by percentage changes that may yield misleading results. For example, look at the following example [3]:
| Year | Amount | Return |
| 0 | $1,000 | – |
| 1 | $1,250 | 25% |
| 2 | $937.5 | -25% |
This example shows that the value of the portfolio increased by 25% to $1,250. The following year, the returns dropped down by 25% and the final value of the portfolio is $937.5. Even though the average returns are 0%, there is a loss of $62.5. By using these values, the CAGR comes out to be -3%. Hence the CAGR is more accurate than the average returns.
Conclusion:
CAGR is a very useful method to calculate the growth rate of an investment . It can be used to evaluate the past returns or predict the future returns of your investments. However, remember that CAGR works suitably only for lumpsum investments. Investors can analyze investment alternatives by comparing their CAGRs from identical periods. Also a direct conclusion worth noticing is that higher the return, higher the future value. So if you kept you capital in a savings account with a 4% annual return, versus a 12% rate every year in a mutual fund portfolio then the value will be higher with the higher rate of return.
FAQ’s Related to XIRR Vs CAGR
Is XIRR better than CAGR?
Mostly, as I have already shared that XIRR gives the same return calculation of CAGR, but CAGR cannot be used for the XIRR calculation. Hence, if you are using a spreadsheet then XIRR is definitely better than CAGR.
What are the drawbacks of XIRR?
The major drawback of XIRR is the same assumption on which XIRR works. Which is that all the cashflows get reinvested in the IRR. However, that might not be always practical. Hence MIRR is the solution to counter this drawback.
How accurate is XIRR?
The XIRR is mostly accurate, with the problem of the generating multiple IRRs. This usually happens when the cash flow changes happen multiple times.
Related
A CFA charterholder with hands-on experience across investment analysis and finance education. At MentorMeCareers, he writes and reviews content on CFA, financial modeling, and investment banking careers — grounded in real market data rather than generic advice, and shaped by what actually helps candidates and professionals succeed.

