Last updated on November 13th, 2025 at 11:21 am
Several companies use different Types of financial analysis both internally and externally. These analyses are a great way for any business to evaluate its financial stability, and for investors to evaluate whether or not your company is a worthy investment. In this article, we will define financial analysis and describe the various types of financial analysis.
Professionals use various financial ratios, trend analysis, and valuation models to identify strengths, weaknesses, and risks.
What is Financial Analysis?
Financial Analysis is the process of evaluating any business project company by digging deep into its finances. This is used to determine the performance and sustainability of the company/ business. Financial analysis is used to analyze whether an entity, business, or company is profitable enough to warrant a monetary investment. The job of a financial analyst includes evaluating trends, setting financial policies, build long term plans for business-related activities, identifying investment opportunities, determining the stability, solvency and liquidity of a company, etc. The analyst will thoroughly examine and analyze the company’s financial statement – Income statement, balance sheet and cash flow statement. Financial analysis can be conducted from the perspective of both corporate finance and investment finance as well [1].
One of the most common ways of analysis is to calculate various ratios using the financial statements like Return of Equity (ROE), Earnings per Share (EPS), P/E ratio, Debt to equity ratio, Return on Capital Equity (ROCE), etc [2].
Financial analysis plays a vital role in:
1.Investment decisions – identifying undervalued or high-growth companies
2.Corporate finance – managing budgets, capital allocation, and expansion
3.Credit analysis – assessing a borrower’s repayment capacity
4.Strategic planning – improving business efficiency and profitability
Why Financial Analysis Is Important for Businesses
Financial analysis is crucial because it helps businesses make data-driven financial decisions instead of relying on assumptions. By evaluating revenues, expenses, profitability, and cash flows, companies can understand how efficiently they’re operating and where improvements are needed.
- Measures Profitability and Performance
- Helps in Budgeting and Forecasting
- Supports Strategic Decision-Making
- Attracts Investors and Lenders
- Detects Risks and Inefficiencies
Types of Financial Analysis
Here are major types of financial analysis:
Horizontal Analysis
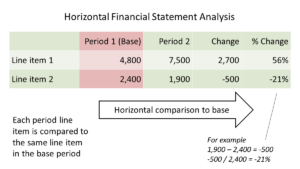
[3]Horizontal Analysis is used to compare data such as ratios or line items over a number of accounting periods (yearly or quarterly). It can either use absolute comparisons of percentage comparisons. It measures the line of the financial statement of items with the base year. This helps in analyzing the growth of the company from Year on Year (YoY) or quarter to quarter. The downside of this analysis is that if the industry is downgrading and still the company is performing better, the trend analysis will show negative growth of the company.
Example: If a company’s revenue increased from ₹50 crore to ₹60 crore in one year, horizontal analysis shows a 20% year-on-year growth.
Vertical Analysis
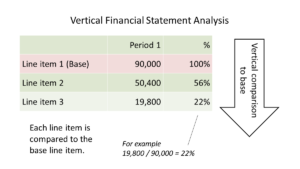
[4]Vertical analysis is the proportional analysis of a financial statement, where each line item on a financial statement is listed as a percentage of another item. The vertical analysis allows proportional analysis of the data. The vertical analysis helps in comparing the entities of different sizes, as it presents the financial statements in absolute form. It represents the data of a single period only, so there can be miss comparison across different time periods.
Example: If total sales = ₹100 crore and cost of goods sold = ₹60 crore, COGS = 60% of revenue.
Trend Analysis
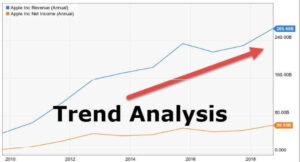
Trend analysis is a way of collecting data and attempting to find a pattern in it. It helps in predicting the future movement that is based on the current ongoing trend. Trends give a brief idea about what has happened in the past and their job is to predict what could happen in the future. Some common terms used in trend analysis are Trendlines, Chart patterns, Indicators, Moving Averages, etc. It analyses the price movement and trade volume.
Profitability Analysis
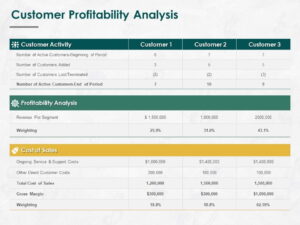
Profitability analysis is an analysis of the profitability of the company or business. This allows companies to maximize their profits, resulting in maximising the opportunities that businesses can take advantage of, in order to continue growing in an extremely dynamic and competitive market. This type of analysis helps in identifying fast/slow moving stocks, market trends, growth opportunities, etc. Ultimately, this helps in the decision making to see a more concrete picture of the business as a whole.
Liquidity Analysis
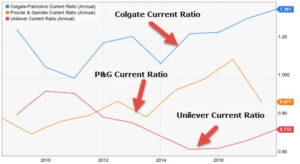
[5]Liquidity analysis uses ratios to determine whether or not a company will be able to pay back any debts or other expenses. This type of analysis is helpful because if a business isn’t able to pay off its liabilities, they’re bound to face financial troubles in the upcoming future. Liquidity analysis is particularly helpful for lenders or creditors who want some insight into your financial standing before offering you a loan or credit. Various ratios such as the cash ratio and current ratio are used in a liquidity analysis.
Ratio Analysis
Ratio analysis uses quantitative relationships between financial statement items to assess a company’s profitability, liquidity, solvency, and efficiency.
Common Ratios:
- Profitability: Net Profit Margin, ROE, ROA
- Liquidity: Current Ratio, Quick Ratio
- Leverage: Debt-to-Equity
- Efficiency: Inventory Turnover
Cash Flow Analysis
Examines cash inflows and outflows from operating, investing, and financing activities to measure liquidity and sustainability.
Example: Even if profits rise, negative cash flow from operations could signal trouble in collections or cost control.
Variance Analysis
Compares budgeted figures with actual results to measure deviations and identify causes.
Example: If budgeted sales were ₹10 crore but actual sales were ₹8 crore, the variance is –₹2 crore (20% adverse).
Scenario and Sensitivity Analysis
Scenario analysis tests how financial results change under different what-if situations (best, base, worst case).
Sensitivity analysis shows how one variable (e.g., sales or cost) affects outcomes like profit or valuation.
Example: A DCF model might test how a ±10% change in revenue impacts valuation.
Comparative & Benchmark Analysis
Compares a company’s performance with industry peers or historical averages to assess competitiveness.
Example: If a firm’s ROE = 18% and the industry average = 14%, it indicates above-average profitability.
| Type of Analysis | Definition | Example | Key Insight |
|---|---|---|---|
| Horizontal Analysis (Trend Analysis) | Compares financial data across multiple periods to identify growth or decline trends. | Revenue increased from ₹50 crore to ₹60 crore → 20% year-on-year growth. | Helps detect performance trends and patterns over time. |
| Vertical Analysis (Common-Size Analysis) | Expresses each line item as a percentage of a base figure like total sales or total assets. | If sales = ₹100 crore and COGS = ₹60 crore → COGS = 60% of revenue. | Useful for comparing cost structure and profitability across companies. |
| Ratio Analysis | Uses relationships between financial items to assess profitability, liquidity, leverage, and efficiency. | Ratios: 1. Profitability – ROE, ROA 2. Liquidity – Current Ratio 3. Leverage – Debt/Equity 4. Efficiency – Inventory Turnover. | Provides standardized metrics for financial comparison and decision-making. |
| Cash Flow Analysis | Examines cash inflows and outflows from operations, investing, and financing activities. | Profits may rise, but negative cash flow from operations can signal collection or cost issues. | Evaluates liquidity, solvency, and sustainability of earnings. |
| Variance Analysis | Compares budgeted vs. actual figures to identify performance deviations and reasons. | Budgeted sales ₹10 crore vs. actual ₹8 crore → ₹2 crore (20%) adverse variance. | Helps monitor budget control and operational efficiency. |
| Scenario & Sensitivity Analysis | Tests how results change under different assumptions or variable shifts. | A DCF model tests ±10% revenue change to see valuation impact. | Measures risk exposure and forecasts financial resilience. |
| Comparative & Benchmark Analysis | Compares company performance with peers or industry standards. | ROE = 18% vs. industry average 14% → above-average profitability. | Assesses competitive standing and best practice performance. |
Types of financial analysis examples
Financial analysis example
Investment Decision: An analyst compares two companies’ earnings, cash flow, and valuation multiples to decide which stock is undervalued.
Budget Control: A finance manager performs variance analysis to see why marketing expenses exceeded budget by 10%.
Bank Loan Assessment: Banks analyze debt-to-equity ratios and cash flows before approving loans.
M&A Valuation: An investment banker uses DCF analysis to estimate the fair value of a target company.
Ratio analysis examples
Ratio analysis uses financial statement data to evaluate a company’s profitability, liquidity, leverage, and efficiency.
| Category | Ratio Name | Formula | Example Calculation |
|---|---|---|---|
| Profitability | Net Profit Margin | Net Profit ÷ Revenue | ₹20 lakh ÷ ₹200 lakh = 10% |
| Liquidity | Current Ratio | Current Assets ÷ Current Liabilities | ₹10 lakh ÷ ₹5 lakh = 2.0 |
| Leverage | Debt-to-Equity Ratio | Total Debt ÷ Shareholder Equity | ₹40 lakh ÷ ₹20 lakh = 2.0x |
| Efficiency | Inventory Turnover | COGS ÷ Average Inventory | ₹80 lakh ÷ ₹10 lakh = 8 times |
| Return | Return on Equity (ROE) | Net Income ÷ Equity | ₹15 lakh ÷ ₹100 lakh = 15% |
Vertical analysis example
Vertical analysis expresses each line item in a financial statement as a percentage of a base figure usually total sales or total assets.
| Item | Amount (₹) | As % of Sales |
|---|---|---|
| Revenue | 1,00,00,000 | 100% |
| Cost of Goods Sold | 60,00,000 | 60% |
| Gross Profit | 40,00,000 | 40% |
| Operating Expenses | 20,00,000 | 20% |
| Net Profit | 20,00,000 | 20% |
Horizontal analysis example
Horizontal analysis compares financial data over multiple periods to identify trends in growth or decline.
| Item | Year 1 (₹) | Year 2 (₹) | Change (₹) | % Change |
|---|---|---|---|---|
| Revenue | 50,00,000 | 60,00,000 | +10,00,000 | +20% |
| COGS | 30,00,000 | 36,00,000 | +6,00,000 | +20% |
| Net Profit | 8,00,000 | 9,60,000 | +1,60,000 | +20% |
Quantitative vs Qualitative Financial Analysis
| Aspect | Quantitative Financial Analysis | Qualitative Financial Analysis |
| Definition | Focuses on numerical data and measurable financial metrics to assess company performance. | Focuses on non-numerical factors like management quality, brand strength, and business strategy. |
| Data Source | Financial statements, ratios, growth rates, market trends, and valuation models. | Interviews, company reports, industry news, leadership insights, and business model analysis. |
| Objective | To measure financial health, profitability, and valuation using hard data. | To evaluate future potential, stability, and sustainability beyond numbers. |
| Key Tools Used | Ratio Analysis, Trend Analysis, DCF Models, Statistical Techniques. | SWOT Analysis, PESTEL Analysis, Management Assessment, Competitive Benchmarking. |
| Examples | Calculating EBITDA margin, ROE, or revenue growth over five years. | Evaluating leadership vision, brand reputation, or corporate governance quality. |
| Approach | Data-driven, objective, and quantifiable. | Observational, subjective, and interpretive. |
| Used By | Analysts, investors, auditors, and credit rating agencies. | Business strategists, fund managers, and corporate consultants. |
| Outcome | Helps determine intrinsic value and performance trends. | Helps assess long-term growth potential and risk factors. |
| Limitation | May ignore qualitative aspects like leadership and innovation. | Can be subjective and difficult to measure consistently. |
Both methods complement each other. Quantitative analysis provides measurable financial accuracy, while qualitative analysis explains why those numbers perform the way they do.A strong analyst always combines data and judgment to form a complete financial picture.
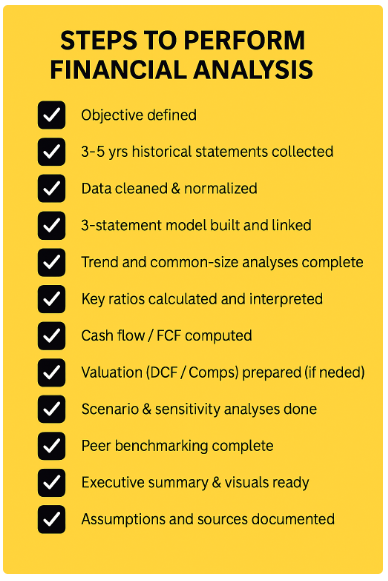
How to Perform Financial Analysis Step by Step
Define the objective
Decide why you’re analysing
2. Gather the right data
Collect historical financial statements (Income Statement, Balance Sheet, Cash Flow) typically 3–5 years.
3.Clean and standardized the data
Ensure consistent accounting policies, fix classification differences, convert currencies if needed, and normalize one-off items
4.Build the financial model structure
Set up a workbook with separate sheets
5. Perform horizontal analysis
Compare line items year-on-year and calculate growth rates (CAGR) to identify trends in revenue, margins, capex and working capital.
6.Perform vertical analysis
Convert statements into percentages (e.g., each Income Statement line as % of revenue, each Balance Sheet item as % of total assets) to compare structure across years or peers.
7.Compute key financial ratios
a.Profitability: Gross Margin, Operating Margin, Net Margin, ROA, ROE
b.Liquidity: Current Ratio, Quick Ratio
c.Leverage: Debt/Equity, Interest Coverage (EBIT / Interest)
d.Efficiency: Inventory Turnover, Receivables Days, Payables Days
e.Cash metrics: Operating Cash Flow / EBITDA, Free Cash Flow
8.Cashflow & free cash flow analysis
Reconcile Net Income to Cash from Operations
9.Valuation
Choose valuation methods per objective
10. Scenario and sensitivity testing
Run best/base/worst scenarios and sensitivity tables
Deliverables:
- Cleaned financial model (Excel) with assumptions tab
- 1-page executive summary (PDF) with key KPIs and recommendations
- Visual appendix: charts, ratio table, sensitivity table
- Supporting data files and source references
Common Tools Used in Financial Analysis
1.Excel:
Microsoft Excel is the most widely used financial analysis tool across industries.It allows analysts to organize data, build models, perform ratio analysis, and create valuation frameworks like DCF, Comps, and LBO models.
a.Build 3-statement financial models (Income Statement, Balance Sheet, Cash Flow)
b.Conduct trend and variance analysis
c.Perform sensitivity and scenario analysis using Data Tables
d.Create charts and dashboards for management reporting
e.Calculate ratios (Profitability, Liquidity, Leverage) and financial KPIs
2. Microsoft power BI:
Power BI is a data visualization and business intelligence tool from Microsoft that transforms financial data into interactive dashboards and reports.
a.Import and consolidate large financial datasets from multiple sources (ERP, accounting systems, Excel).
b.Create dynamic dashboards showing KPIs like revenue growth, cost trends, and cash flow.
c.Perform drill-down analysis to identify cost drivers or profit segments.
d.Automate monthly management reporting and variance tracking.
3.Tableau:
Tableau is another leading data visualization and analytics tool, known for its intuitive interface and powerful charting capabilities.
a. Build interactive dashboards for financial KPIs and trends
b. Visualize time-series data like revenue growth or expense breakdown
c. Identify patterns and outliers using heatmaps, scatter plots, and treemaps
d. Combine financial and operational data for deeper insights
a. Create automated, scenario-driven models for forecasting and budgeting
b. Perform multi-entity consolidation and real-time variance tracking
c. Integrate with ERP systems for continuous updates
d. Run Monte Carlo simulations for sensitivity and risk analysis
Conclusion
Financial analysis determines a company’s health, stability, and performance which provides an understanding of how the company conducts its business. It is important to know that financial statement analysis has its limitations as well. Different accounting methods adopted by different firms change the visible health and profit levels for either better or worse. Different analysts may get different results from the same information. Hence, we must conclude that financial statement analysis is only one of the tools (although a major one) while taking an investment decision.
FAQ
The five main types of financial analysis are:
1. Horizontal Analysis (Trend Analysis) – compares data over time.
2. Vertical Analysis (Common-Size Analysis) – shows each item as a percentage of a base figure.
3. Ratio Analysis – measures profitability, liquidity, and solvency.
4. Cash Flow Analysis – tracks inflows and outflows of cash.
5. Variance Analysis – compares actual performance against budgeted targets.
These methods together help businesses assess performance and identify improvement areas.
Which financial analysis is best for business valuation?
For business valuation, the most effective method is the Discounted Cash Flow (DCF) analysis because it measures a company’s intrinsic value based on future cash flows. Analysts also use Comparable Company Analysis (Comps) and Precedent Transactions to benchmark valuations.
In practice, a mix of these approaches provides the most accurate valuation range.
Common examples of financial analysis methods include ratio analysis, trend analysis, common-size analysis, cash flow analysis, scenario analysis, and benchmark analysis.
Each serves a different purpose from evaluating profitability and liquidity to forecasting financial performance and risk under different conditions.
The most popular tools for financial analysis are:
1.Microsoft Excel – for financial modelling and ratio calculations.
2.Power BI & Tableau – for dashboards and visual reporting.
3.Accounting Software (Tally, QuickBooks) – for transaction data.
4.Financial Modelling Software (Anaplan, Adaptive Insights) – for forecasting and scenario planning.
These tools help analysts convert financial data into clear, data-driven insights.
1.Income Statement – shows a company’s revenue, expenses, and profit over time.
2.Balance Sheet – reports assets, liabilities, and shareholder equity at a specific date.
3.Cash Flow Statement – details cash inflows and outflows from operations, investing, and financing.
4.Statement of Changes in Equity – tracks changes in ownership interest and retained earnings.
Together, these financial reports provide a complete view of a company’s profitability, liquidity, and solvency.
A 3-way financial analysis (also known as a 3-statement model) connects the Income Statement, Balance Sheet, and Cash Flow Statement into a single dynamic model.
It allows analysts to see how profitability, assets/liabilities, and cash generation interact.
1.Cash Accounting – records transactions when cash is received or paid.
2.Accrual Accounting – records income and expenses when earned or incurred, regardless of cash flow.
3.Managerial Accounting – focuses on internal decision-making and cost control.
4.Tax Accounting – prepares financial information for government tax compliance.
Each type serves a specific purpose from managing daily operations to meeting statutory reporting requirements.
1.Revenue Recognition Principle – record revenue when earned, not received.
2.Matching Principle – match expenses with related revenues.
3.Cost Principle – record assets at historical cost, not market value.
4.Full Disclosure Principle – disclose all relevant financial information.
5.Objectivity Principle – base reports on verifiable, unbiased evidence.
Common-size analysis is a method of financial analysis where each line item in a statement is shown as a percentage of a base figure. In the income statement, every item is a percentage of total sales. In the balance sheet, each item is a percentage of total assets.
This makes it easier to compare companies of different sizes and analyze cost structures and profitability trends.
Horizontal analysis compares financial results over multiple periods to show growth or decline trends (time-based comparison).
Vertical analysis compares line items within a single period as percentages of a base figure (structure-based comparison).
