Last updated on July 6th, 2026 at 02:00 pm
If you were just looking for the , proprietary ratio then you don’t need to read any further.Instead, if you are looking for some deeper insights and also want to know why you never heard of this formula then read on
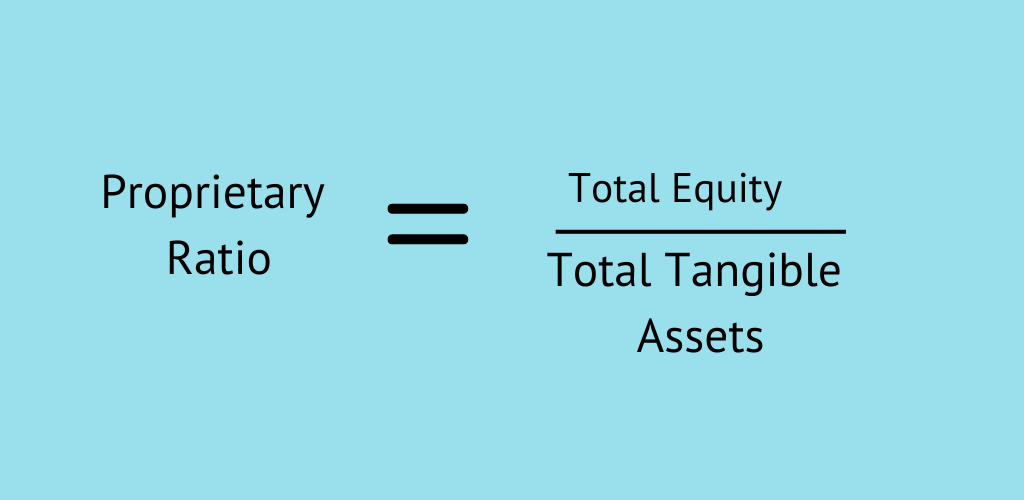
Proprietary Ratio Formula = Total Equity/ Total Tangible Assets
Formula for Proprietary Ratio
Interpretation of Proprietary Ratio Formula
If you look at this simply straight then, we are saying this:
Meaning of Proprietary Ratio
“What proportion of tangible assets belong to the shareholders”
Now, you may ask why does that matter? Well, it doesn’t and that’s why it the limited use.
However, if you want to look at the long term solvency of a particular company, then this might be a fancy way.
Look at the balance sheet below of Tata Steel;
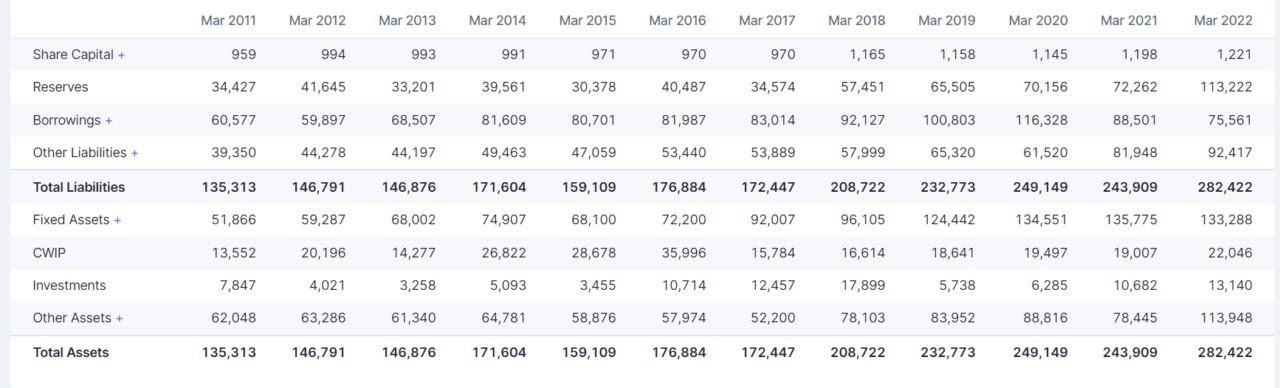
So, If we calculate then we get:
- The proprietary ratio for this company then comes as (Share capital and Reserves and surplus)/ Fixed assets. Which comes out to be=1.0079.
But wait! What does that even mean? i.e 1.0079?
So, numerically all it means, is that shareholders’ equity is almost equivalent to fixed assets.
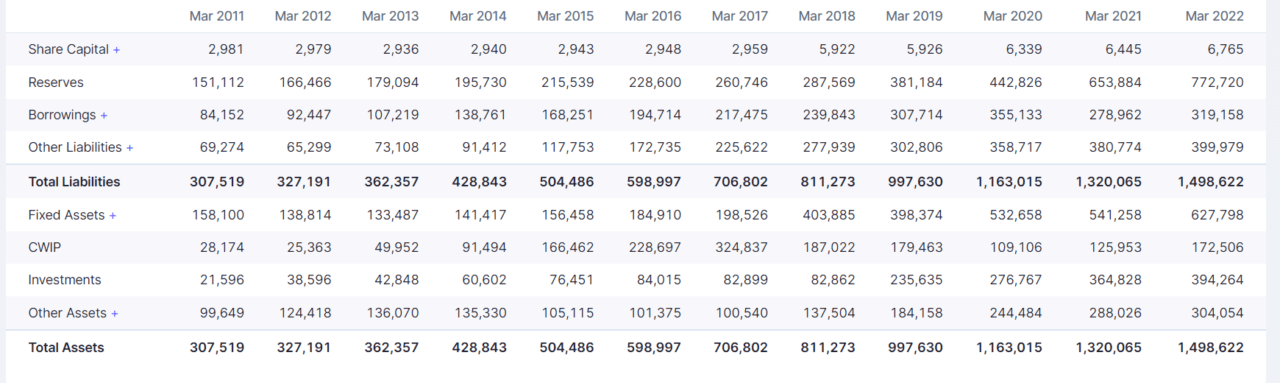
So if we calculate the same ratio for reliance industries we get, 1.24.
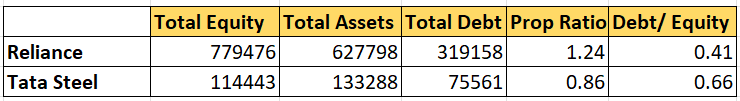
Now, I will summarise the findings! Which, if you see that Reliance has lower debt compared to tata steel, but has a high proprietary ratio.
So, that means lower debt leads to a higher proprietary ratio! This makes total sense, after all, it is a proprietary ratio, right?
Assumptions in Proprietary Ratio Formula
The most significant assumption in the proprietary ratio is off-balance sheet financing. Now, you might wonder what off-balance sheet financing is.
Let me explain this with an example;
Let’s suppose, I started a business for building garbage disposable bags. Also, the machine required to make these bags is available at a purchase price of $5000. Now, there are two methods by which, I could not only get this machine but also manage the leverage of the company.
- Firstly, I could simply approach a bank and get a loan of 80% of $5000.
- Secondly, we can tie up with a company that leases the same machine without buying it.Hence we fund and total assets remain same as before.
Hence, the first method would increase our debt in the company and make us look risky. However, in the second method, the only thing visible in our financial statements would be the rent.
So, this kind of financing won’t be captured in the proprietary ratio = Total tangible assets( Because was never owned)/ Equity( No change in equity ratio). So our capital structure would appear to be entirely equity.
Another assumption is that it doesn’t consider intangible assets.
Proprietary Ratio Formula Examples
Let’s consider some examples to understand how proprietary ratio formula can be used to compare two companies;
Company A:
- Total Assets: $200 million
- Shareholders’ Equity: $100 million
Company B:
- Total Assets: $400 million
- Shareholders’ Equity: $240 million
Using the proprietary ratio formula for each company:
Company A: Proprietary Ratio = Shareholders’ Equity / Total Assets Proprietary Ratio = $100 million / $200 million Proprietary Ratio = 0.5 or 50%
Company B: Proprietary Ratio = Shareholders’ Equity / Total Assets Proprietary Ratio = $240 million / $400 million Proprietary Ratio = 0.6 or 60%
Interpretation: In this example, Company A has a proprietary ratio of 50%, while Company B has a proprietary ratio of 60%.
The interpretation of these ratios might include the following points:
- Company A: With a proprietary ratio of 50%, Company A finances half of its assets through equity, indicating a moderate level of financial stability. This could suggest that the company has a balanced mix of equity and debt in its capital structure.
- Company B: With a proprietary ratio of 60%, Company B finances a larger portion of its assets through equity. This might indicate a lower level of financial risk, as the company has more equity to cover potential losses. However, it could also suggest that the company is more cautious about taking on debt, which could limit its growth potential.
Investors and analysts would consider these ratios along with other financial metrics and qualitative factors to gain a comprehensive understanding of the companies’ financial positions and risk profiles. Comparing the proprietary ratios of Company A and Company B provides insights into their capital structures and risk management strategies. Keep in mind that the interpretation can vary based on industry norms, economic conditions, and the specific strategies of each company.
Why analysts don’t use the proprietary ratio formula?
For the same reason, what we experienced.
I mean why would you entangle your hands from behind your nose to catch the same nose?
Firstly debt to equity gives almost the same information as this ratio. Then why look for the same information again?
Similar Ratios like this
There are multiple such behind-the-nose ratios, which you could use to infer almost the same information under the category of
- Leverage Ratio: Assets / Equity share capital, which is the reverse of the prop ratio. The higher this ratio the more leverage you have.
- Debt to total capital: Debt/ (Equity+Debt), which is to find the proportion of debt to the total capital employed
- Debt to Equity: Debt/Equity, which is how many times debt is compared to equity.
Moreover, all the above ratios, infer the same information.
Suggested Readings
A CFA charterholder with hands-on experience across investment analysis and finance education. At MentorMeCareers, he writes and reviews content on CFA, financial modeling, and investment banking careers — grounded in real market data rather than generic advice, and shaped by what actually helps candidates and professionals succeed.

