Last updated on October 23rd, 2024 at 02:51 pm
Have you ever wondered how technical analysts analyse charts and make trading decisions? They use candlesticks in this process. Candlesticks are a specialised tool that packs data for multiple timeframes into single bars. These bars are very simple and easy to read. Multiple candlesticks form different patterns, which can help predict price action. In this article, we will be looking at the Evening Star Pattern.
Key takeaways on Evening Star Pattern
- Firstly, it’s a bearish reversal pattern
- Secondly, it can be used by traders for short term predictions
- Finally, you need to be careful because it can give you false signals
Brief about Candlestick Patterns
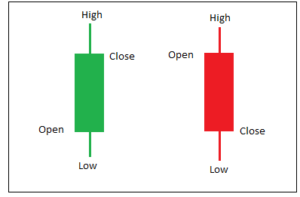
A Candlestick is a price candlestick pattern that depicts the Open, High, Low and Close of a particular security for a specific period. Candlesticks are vastly used to analyse the price movement in Technical Analysis.
- The concept of Candlesticks was first developed in the 1700s by Munehisa Homma, a Japanese rice trader [1].
- He found a link between the price and supply and demand of rice and the trader’s emotions.
- Candlesticks depict the feelings of the traders by visually representing the size and colour of the candlestick. Traders make decisions based on these candlesticks.
- Candlesticks were first introduced to the western world by Steve Nison in his book, Japanese Candlestick Charting Techniques [2].
The Basics of Candle Stick Chart
Now, you must understand the meaning of these colours, the size of the candle and the tip of these lines.
- Green candle: This means that the closing price of today was higher than yesterday
- Red Candle: Signifies that the closing price was lower than yesterday
- Size: Longer the candle, the bigger the fluctuation during the day( or any other timeline).
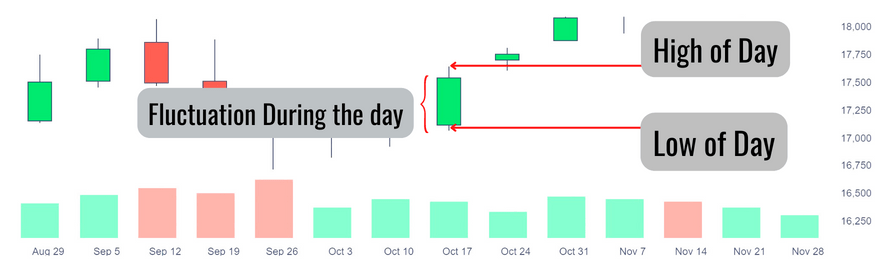
So, notice that on October 17th, the candle is green, which means closing was higher than on October 10th. Also, look at the October 24th candle; although green, the size is small.
Evening Star Pattern?
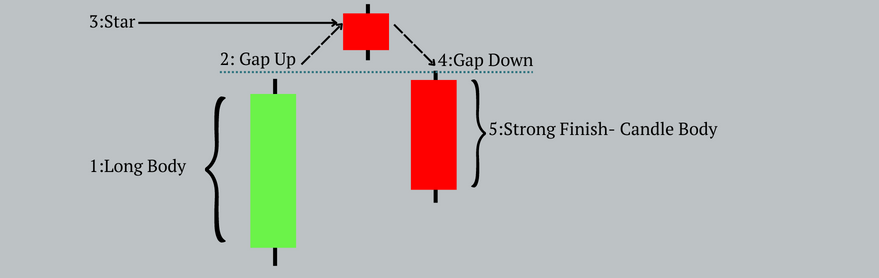
So, in straightforward logic, an evening star pattern is comprised of the following;
- A long green candle
- Followed by a gap up(E.g., the Opening price of NSE is 100, but yesterday the closing was 80. So the gap up is 20).
- Next is the formation of a little red candle. Which is the star
- Then, there is a gap down.
- Finally, a long red candle.
Trading Position in evening star pattern
In an evening star pattern, the trader usually looks at a bearish reversal. In other words, the trader expects the market to take a U-turn. Hence, the trader can take a short position in the market, making money while the market goes negative.
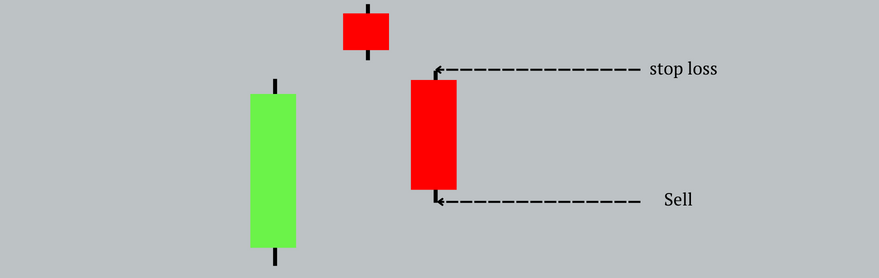
- So, the selling price would be the lowest closing price of the day.
- Stop loss maintained at the high of the day.
How Reliable is the evening star pattern
So this pattern is a useful tool for the technical analyst as it can predict market sentiment and changes in price momentum. The Pattern consists of three candles, one for each day.
On the first day, the asset price moves upward with solid momentum. This momentum weakens on the second day, and a star-like Candlestick appears. A lot of indecisiveness occurs on the second day between the bears and the bulls. If the market opens the gap down on the 3rd day, it indicates that the momentum will be reversed, indicating the traders to make a short position. When the price is comparatively lower on day 3, the evening star pattern is confirmed.
The more petite body suggests a balance between the buyers and sellers. The star signal slows the momentum formed by the previous candle.
Strengths and Weakness of evening star pattern
- Firstly, the biggest strength of this pattern is its simplicity. So, require three candles in total.
- Secondly, the most important use apart from going short is protecting the profits.
- Crypto traders tend to exit markets when an evening star pattern is formed.
However, you must understand that just like any other pattern, even this pattern can be a false alarm. Accordingly, you must ensure you are not risking more than one per cent of your total capital in any specific trade.
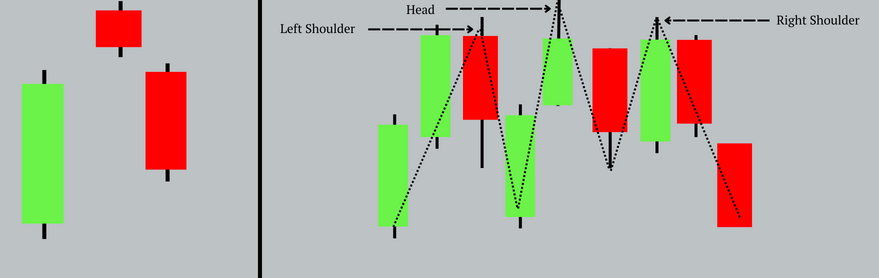
Evening Star Pattern Vs. Head & Shoulders
Now, compared to a head and shoulder pattern which requires at least five candles at the minimum. In comparison, the evening star pattern requires just three candles. Also, there can never be a perfect head and shoulder pattern.
Evening Star Pattern vs. Morning Star Pattern
The Evening Star Pattern is often compared with the Morning Star Pattern, which is a bullish reversal pattern. While the Evening Star signals a bearish reversal at the top of an uptrend, the Morning Star indicates a bullish reversal at the bottom of a downtrend. Both patterns consist of three candles, but the direction and market conditions they signal are opposite.
Disadvantages of Evening Star Pattern
The Evening Star pattern is a bearish reversal pattern that you can use to predict a potential trend reversal in the stock market. However, like any technical analysis tool, the Evening Star pattern has its limitations and potential disadvantages.
False Signals:
The Evening Star pattern is not always a reliable indicator of a trend reversal. It can produce false signals, particularly in markets that are experiencing high volatility or are in a strong uptrend. This can lead to false predictions and lost profits for traders who rely too heavily on the pattern.
Dependence on Candlestick patterns:
The Evening Star pattern is based on the interpretation of cand stick patterns, which are subject to interpretation and can be affected by various factors such as the timeframe of the chart, the volume of the trade, and the market conditions. This means that the pattern is not always a reliable indicator and may not be applicable in all market conditions.
Not a standalone indicator:
The Evening Star pattern should not be used as a standalone indicator, but rather be combined with other indicators and analysis to confirm the trend reversal.
Limited to short-term predictions:
The Evening Star pattern is primarily used for short-term predictions, as it is based on the analysis of past trends. It is not as effective in predicting long-term trends and market movements.
Risk of missing potential opportunities:
By relying too heavily on the Evening Star pattern and interpreting it too rigidly, traders may miss potential opportunities to enter or exit a trade.
In summary, the Evening Star pattern is a bearish reversal pattern that can be used by technical traders to predict a potential trend reversal in the stock market. However, it has its limitations and potential disadvantages such as false signals, dependence on cand stick patterns, not being a standalone indicator, limited to short-term predictions, and the risk of missing potential opportunities. Therefore, it should be used in combination with other indicators and analysis to confirm the trend reversal.
The Bottom Line
The three-candle pattern is much easier to spot than a similar complex pattern, which is, actually, the strength of this model itself.

