Last updated on September 19th, 2024 at 12:20 pm
Dragonfly Doji Candlestick, gravestone doji is a candle stick pattern with open, high, and low close patterns.
Typically you would use it to find and point reversal patterns in share or asset prices.
Have you ever wondered how technical analysts analyse charts and make trading decisions? They use candlesticks in this process. Candlesticks are a technical tool that packs data for multiple timeframes into single bars. These bars are very simple and easy to read. There are many types of Candlesticks, including a Dragonfly.
Key Takeaways: dragonfly doji
- Firstly,This pattern can either be pre or post-the price decline or rise.
- Secondly,If you find this pattern after a price decline then you can assume that a possible prise rise can happen.
- Thirdly, Price fall is assumed if this pattern appears after a price rise
- Finally, Investors usually wait for one day after the pattern to act on this.
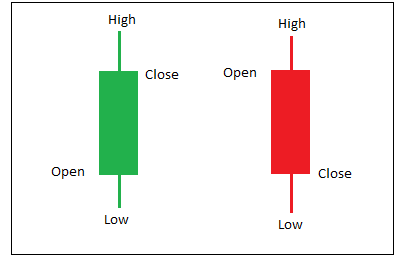
What is a Candlestick?
A Candlestick is a price chart that depicts the Open, High, Low and Close of a particular security for a specific period. Candlesticks is vastly used to analyze price movement in Technical Analysis. The concept of Candlesticks was first developed in the 1700s by Munehisa Homma, a Japanese rice trader [1]. He found a link between the price and supply and demand of rice and the emotions of the trader. Candlesticks depict the emotions of the traders by visually representing the size and colour of the candlestick. Traders make decisions based on these candlesticks.
Candlesticks were first introduced to the western world by Steve Nison in his book, Japanese Candlestick Charting Techniques [2].
What is a Doji Candle chart?
A Candlestick chart type is used in technical analysis. It has a small length which indicates a small trading range. The opening and closing price of the security in this period is equal or has a very small difference. The appearance of this candlestick has a form of a plus sign, a cross or an inverted cross. Its presence of it signals a reversal pattern for technical analysts. In Japanese, “Doji” means blunder or mistake [3]. Depending on where the open and close price is,it is categorized into 5 types: Standard, Long upper shadow-legged, Dragonfly, gravestone doji candlestick pattern and 4-Price.
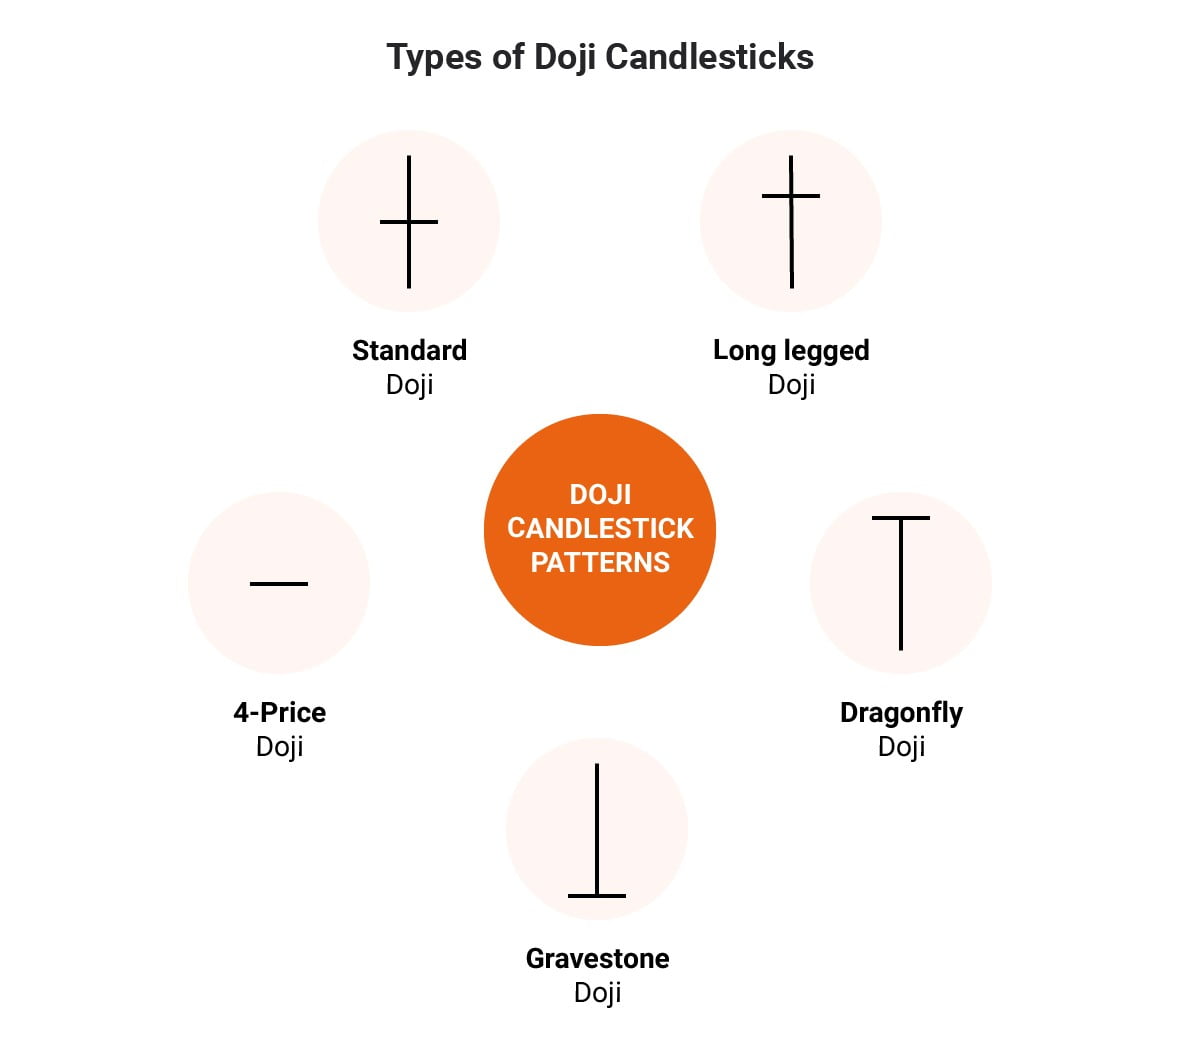
Types of doji candlestick
Standard Star Doji
Now there are various types of Doji formations candle patterns, and the first is, of course, the standard one. This is also known as the star Doji. Hence, In simple words. It means that the open and close have happened at the same level. Also, it implies that the price has moved in a minimal range.
Signal: Indecisive stand of the market participants
Long Legged Doji
So, it’s pretty evident that the price movement is equal between the bulls and the bears. However, since there is active participation from both the bulls and bears, suggesting volatility in the price soon.
Grave Stone Doji

Since the opening and closing is very closer to the low of the day, it might suggest that the on top of an uptrend might be coming to an end. Hence it means a long position will not work.
Dragonfly Doji Candlestick

Now, Quite the opposite to gravestone doji, since the opening and closing are close to the high of the day. Hence this might suggest that a downtrend might be coming to an end. Hence this can be used to establish a short position.
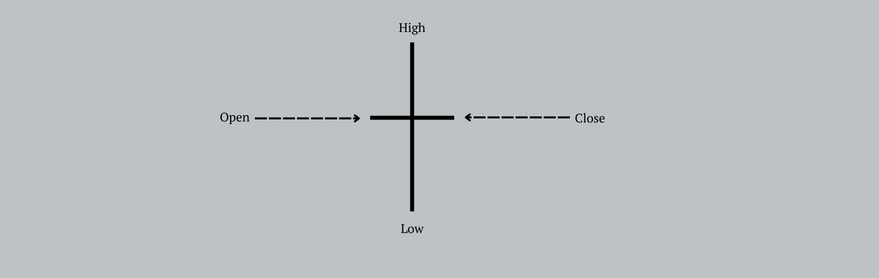
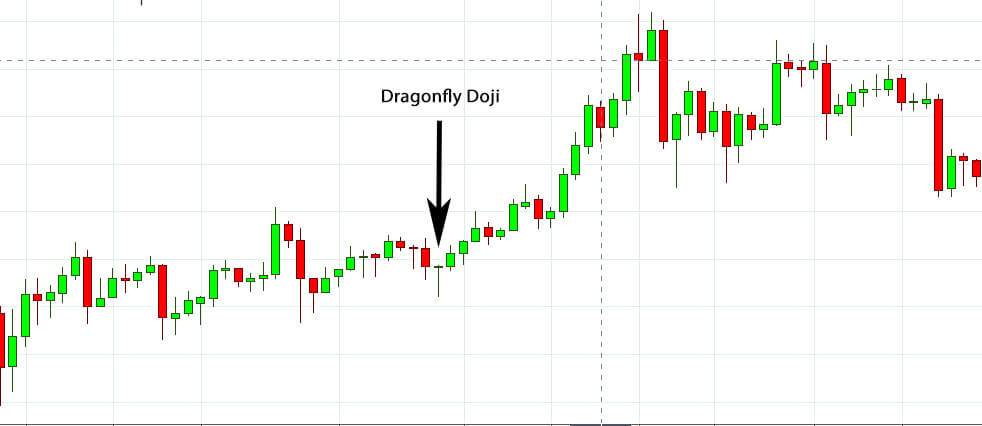
Dragonfly doji candlestick pattern
Candlestick pattern that signals a possible bearish reversal in the price of a security. The reversal can be a downside or an upside. The Dragonfly Doji is formed when the security’s high, open and close prices are the same.
The long lower shadow suggests that there was aggressive selling during the period of the candle. Since the closing and open is the same, it also indicates that the buyers were able to absorb the selling and push the price back up again.
Here is a formation of it looks.
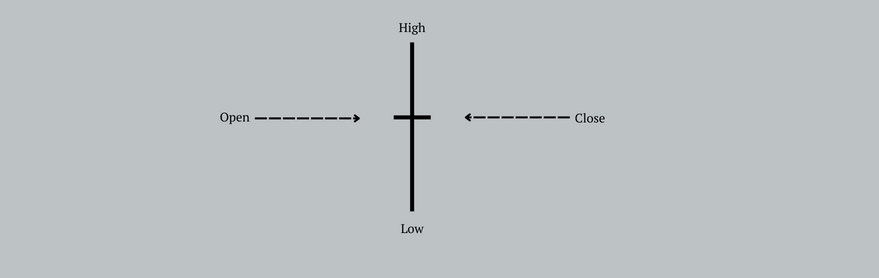
Significance of Dragonfly Doji pattern
The long lower tail of the candlestick indicates that the sellers are in control and have flooded the market which has caused the downward price movement of the security in a certain period. The candlestick itself represents the period. At the end of the period, however, the closing price is equal or almost equal to the opening price.
This indicates that the buyers were able to sustain the aggressive sellers and they managed to push the price back up again.It is an indicator of a reversal taking place during the price movement. When the security is showcasing a downtrend, a formation of this pattern might signal an upcoming increase in the price of the security. In this case, it is known as a bullish dragonfly. If the candlestick right after the bullish dragonfly closes at a higher price, then the price reversal is confirmed, and the trader can make his decision.
On the other hand, if the market has shown an upward trend previously and a formation might signal an upcoming decrease in the price of the security. The downward movement of the next candlestick will confirm the downward trend.
Volume and Dragonfly Doji Candlestick Pattern
The volume is a crucial aspect of confirming a dragonfly doji candlestick pattern. Higher volumes during the formation of a Dragonfly Doji provide a more reliable indicator of potential price reversal. When traders see a Dragonfly Doji with significant volume, it suggests strong market participation, making the reversal signal more trustworthy.
Limitations of Dragonfly Doji
A lot of technical analysis patterns are limited by the biggest challenge, which is you can discover only after the event has occurred. On top of that the other challenge, is that this pattern rarely occurs and even if it occurs it needs to occur with larger volumes.
Gravestone Doji and Long-Legged Doji
The Gravestone Doji, with its open and close near the day’s low, is the opposite of the Dragonfly Doji and suggests an end to an uptrend. The Long-Legged Doji indiTates equal pressure from bulls and bears, leading to potential price volatility.
Conclusion
Of course, it occurs very rarely but price reversal happens constantly. Thus, this candlestick is not considered a good indicator for reversal patterns. Traders generally use a dragonfly to make trading decisions. They create orders immediately after the trend of confirmed by the next candlestick.
The trader can put a stop-loss below the low of the bullish dragonfly candlestick.
Traders should also note that just because you see a confirmation, that does not necessarily mean that there will be a reversal.
Higher volume is more reliable than lower volume Dragonfly Doji. Traders must use other technical indicators as well to identify proper entry and exit points.
FAQ
The following are common questions related to the pattern.
- Is this Dragonfly doji, a pattern a sign of a Bull or Bear Market?
Most of the technical indicators or patterns are indicative of reversal patterns.Hence they are neither bullish nor bearish. Also usually traders even if the pattern appears will wait for the next day to verify.
- Is the dragon fly dogi, a trend reversal pattern?
It is a transitional pattern as opposed to a reversal or continuation pattern.
References
| [1] | R. L. Greg L. Morris, Candlestick Charting Explained: Timeless Techniques for Trading Stocks and Sutures, Unknown: McGraw-Hill Education, 2006. |
| [2] | S. Nison, Japanese candlestick charting techniques: a contemporary guide to the ancient investment techniques of the Far East, Unknown: New York: New York Institute of Finance, 2001. |
| [3] | "Doji," Corporate Finance Institute, [Online]. Available: https://corporatefinanceinstitute.com/resources/knowledge/trading-investing/doji/. [Accessed 12 October 2021]. |
A CFA charterholder with hands-on experience across investment analysis and finance education. At MentorMeCareers, he writes and reviews content on CFA, financial modeling, and investment banking careers — grounded in real market data rather than generic advice, and shaped by what actually helps candidates and professionals succeed.

