Last updated on October 23rd, 2024 at 03:03 pm

Window dressing is a short term strategy used by business’s , portfolio managers to show case good performance to their investors or shareholders.
Types of Window Dressing
So simply put, painting a rosy picture to your clients, shareholders or investors. Let me illustrate this using some types;
In Investments
In Investment management, Window Dressing is a strategy used by many portfolio managers and mutual funds to improve the appearance of their fund’s performance before presenting it to a client or shareholder.
For example you can sells stocks with larger losses and purchases stocks having great returns near the end of the quarter or year.
In Accounting
Window dressing also refers to the efforts taken by a company or organization to make their financial statements more appealing before they are released to the public.
This can be achieved by postponing payments or finding a way to book early revenues.
Illustration of Windows Dressing
Let’s assume that a fund investing in the stocks from the S&P 500 has underperformed the index. That fund has 4 stocks: A, B, C, and D. Stocks A and B outperformed, but were underweight in the fund, while stocks C and D were overweight in the fund but lagged the index.
To make it look like the fund was investing in stocks A and B all along, the portfolio manager sells the stocks C and D and replaces them with A and B. This gives an overweight to the stocks A and B.
Real Life Case Studies:Window Dressing
Now let me illustrate real life cases which is the result of window dressing or accounting gimmicks. The interesting part is that how many large broking houses, with qualified analyst don’t spot such gimmicks
The Fall of Cox & Kings in India
There is a saying that old is gold but all that glitters is also not gold. Cox and kings is a company which had been in existence since the colonial period. With big names running the organisation and big associations. However, these have no meaning when greed takes over principles.
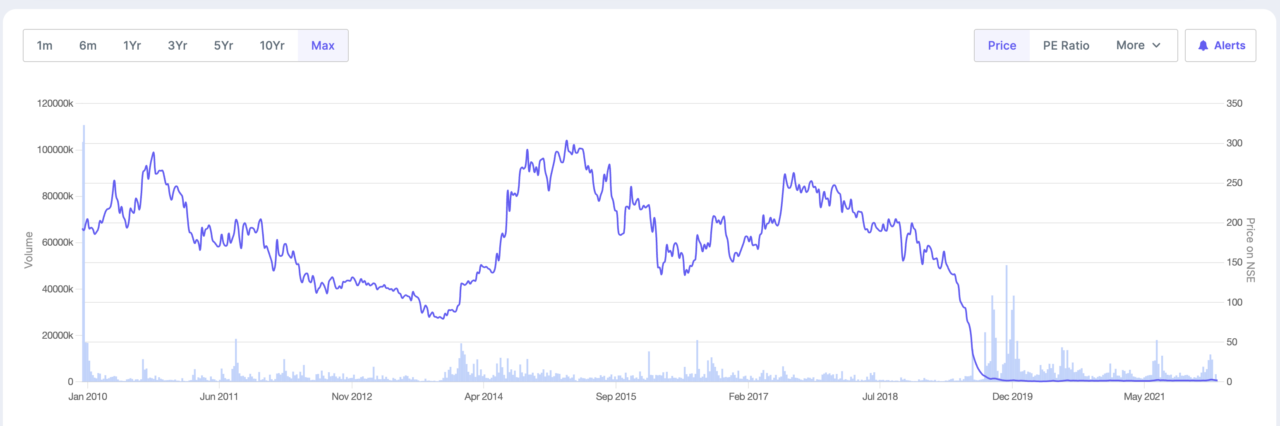
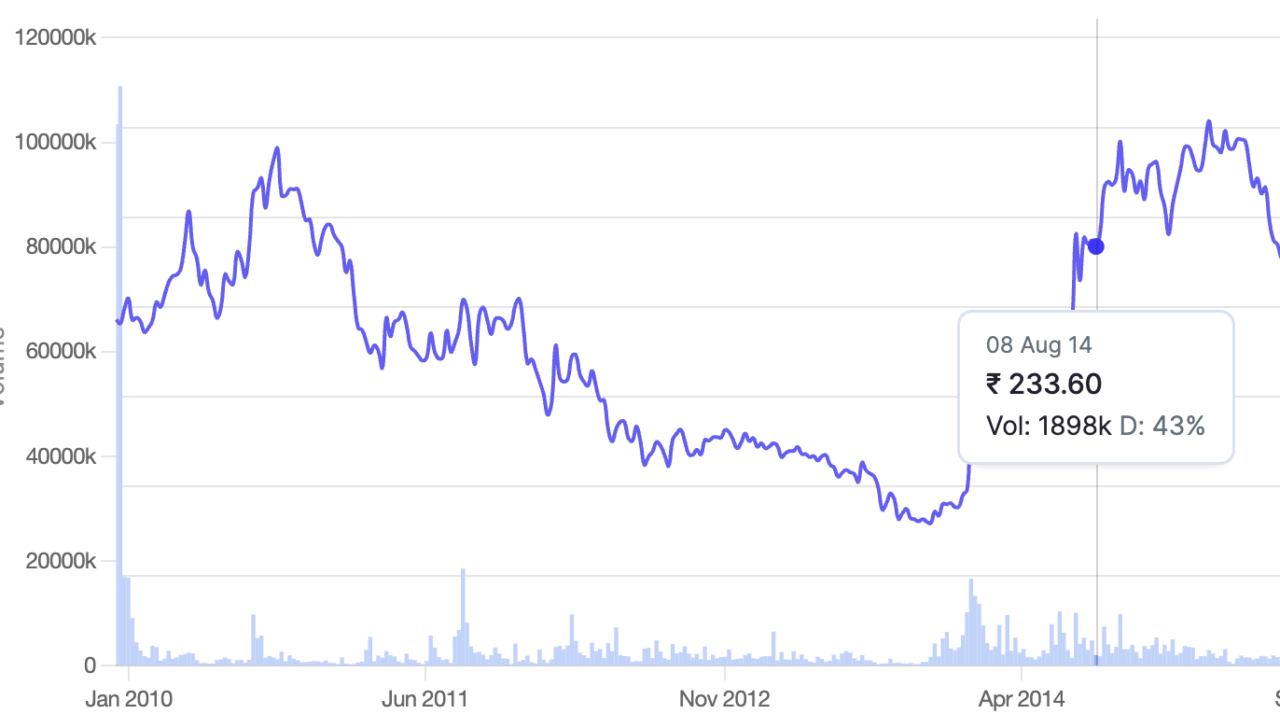
Below is the rise and fall of Cox and kings. The company launched its first intial public offering on 19th November 2009 at 330 Rs per share.
Look Deeper than the Popular Line Items
Whenever you analyse a company, it’s important to go deeper than what you are first presented. Or rather think of it this way, won’t a company present is revenue exaggerated than what it is?
Some of the most common parameters that even a non- analyst knows about are;
- Revenue and its growth
- Net profit & EPS
- Popular ratios like Price to earning
- Net profit growth
- Debt to Equity
As a creator of financial statements with crores spent on hiring the best auditing team, would you not present the best? It’s not to say that it’s wrong or illegal. Usually, there won’t be outright fraud but legal exageration.
Revenue Versus Receivables
So, firstly look at how the revenue seems to be growing year on year. But also look at the growth of receivables. We follow an accrual accounting system, where all revenue is not cash. Revenue recognition requires you to full fill certain conditions to record revenue.
For example;
- Transfer of Risk
- Sending of Invoice
- Or shipping of goods
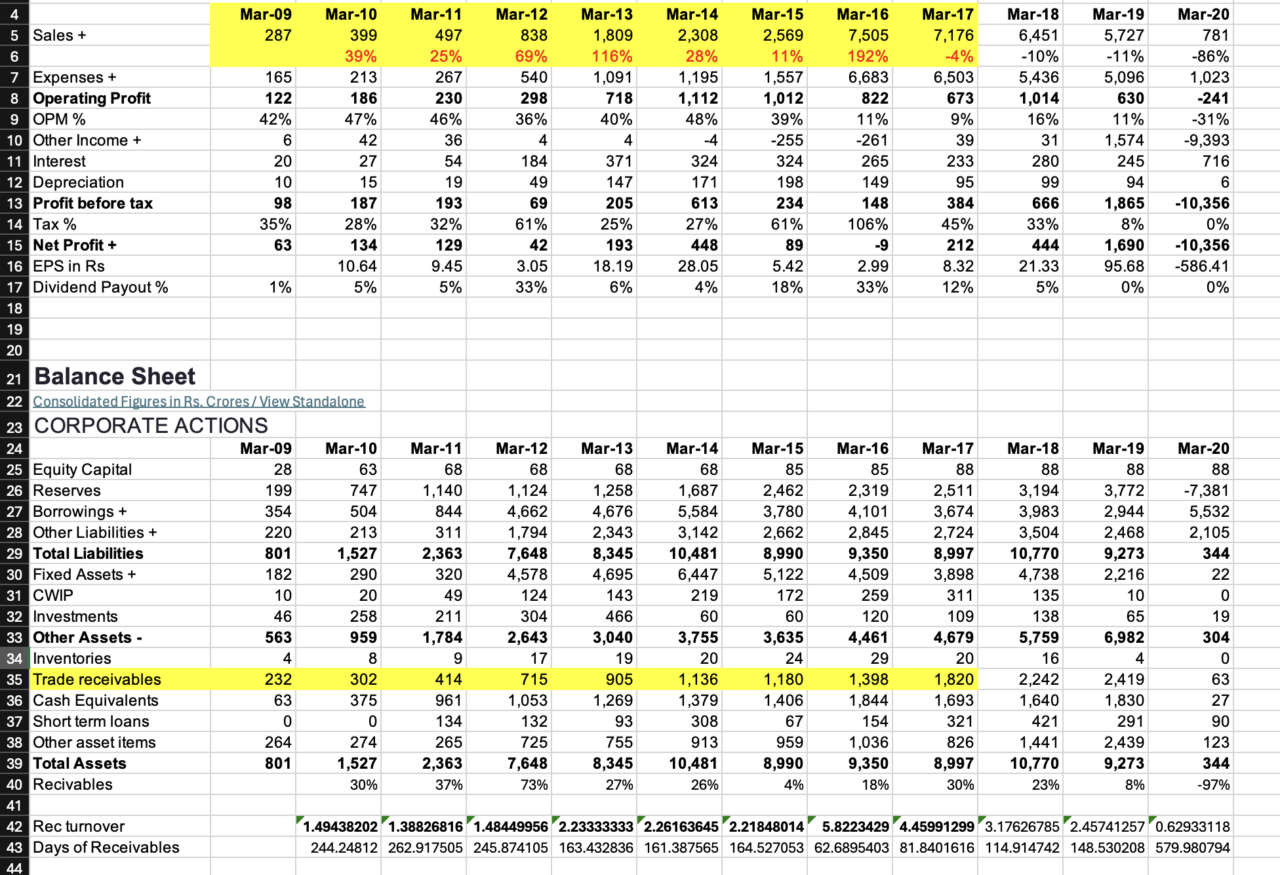
Also look something very interesting. Until 2019 the total receivables are 2419 Cr but in 2020 when the auditor was changed the actual recievables go down as loss to 63 Cr.
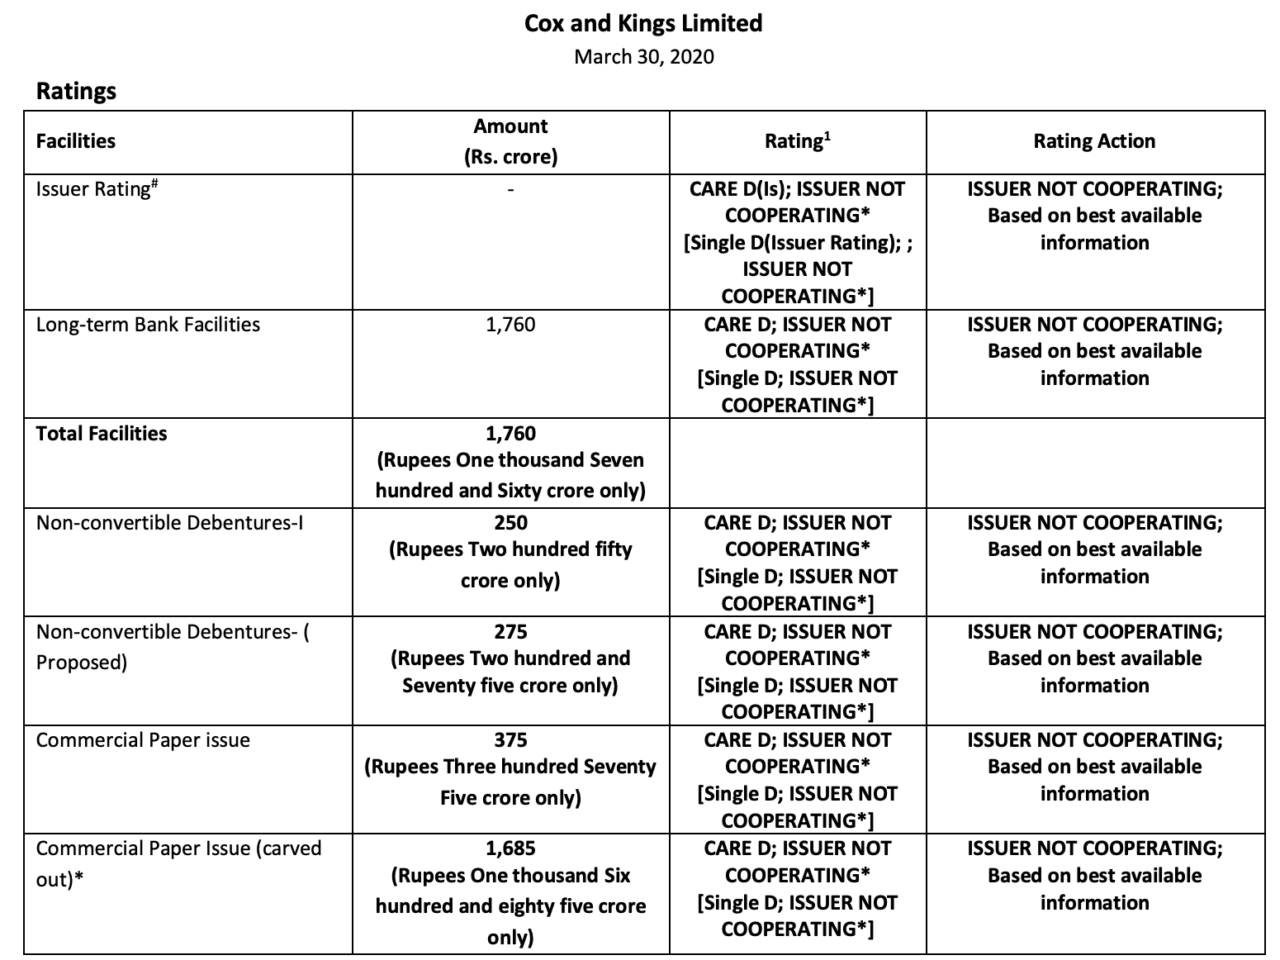
Debt Ratings
The debacle of the cox and kings started in the accounting period 2017 on wards when it started defaulting on the debts. Below I have put an image of Care ratings on the poor performance of company management.
Cashflow & Free Cash flow
So companies, that would most likely be painting a rosy picture of their financial information, cannot do that with cash. Cash window dressing is not possible, because cash and cash flow don’t have an assumption.
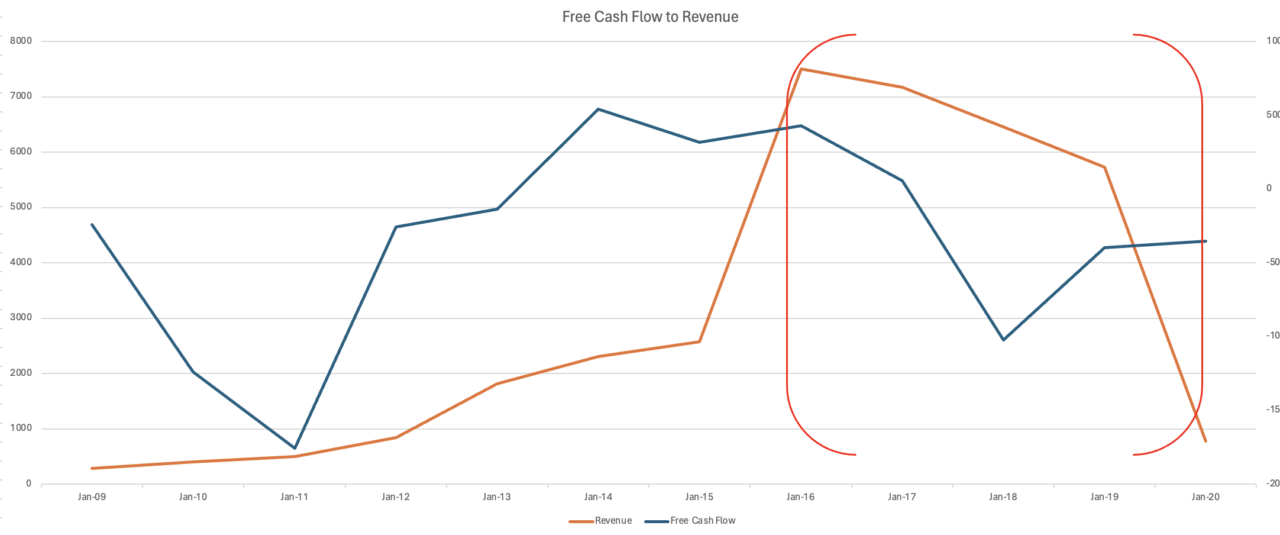
Points to note here:
- Pre 2015 the revenue (marked in orange ) and free cash flow( marked in blue) are both increasing.
- After 2015 notice how the free cash flow drops
- Also notice the erratic movement of free cash flow of the company.
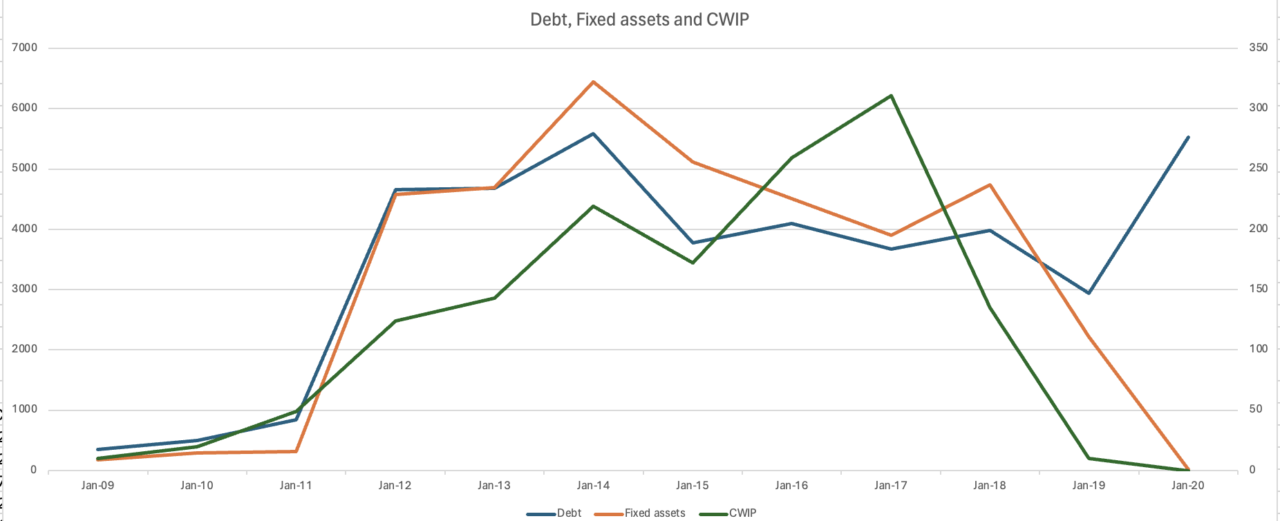
Fixed Assets, CWIP & Debt
A simple way to understand this indicator is to understand when should a company expand? When it gets success on its existing business. Which also needs positive free cash flow. However notice the following pointers
- Capital work in progress increasing but never decreasing
- Fixed assets , debt and CWIP all are increasing
Usually CWIP. means asset under construction, which is also a method of fixed asset window dressing. So why would a company declare CWIP and not convert into fixed assets. let me list down the reasons;
- Firstly If you keep assets under construction or CWIP, then you don’t have to take the depreciation expense.
- Secondly, a very easy and popular way of siphoning cash balances in the name of CWIP.
Capitalisation of Expenses
Capitalization window dressing is another gimmick yet these are all legal methods. A company can attribute the interest expense of an asset under construction as a part of the asset itself. For this my recommendation is to understand and analyse
- The interest expense as a percentage of total borrowings. If the interest expense is significantly lower than the usual industry average, then there is a good chance of expense manipulation.
- Research and development expenses which don’t yield any real patents is again a place where the money is getting siphoned off.
Summarising the Top Indicators of Window Dressing
So now let me create a gist of the indicators to look for initially, before even attempting to analyse the company further are;
- Free cash flow to revenue ( Decrease of free cash flow low indicates aggressive revenue recognition)
- Recievable Days ( High increase In receivable days year on year compared to revenue)
- High CWIP as a % of fixed assets (Indicates that company is misusing the capital)
- Change of accounting methods. For example a company that frequently changes from straight line depreciation method to units of production method
- A company which changes its accounting methods in revenue recognition into methods like percentage completion
- Or expenses window dressing using capitalisation methods.
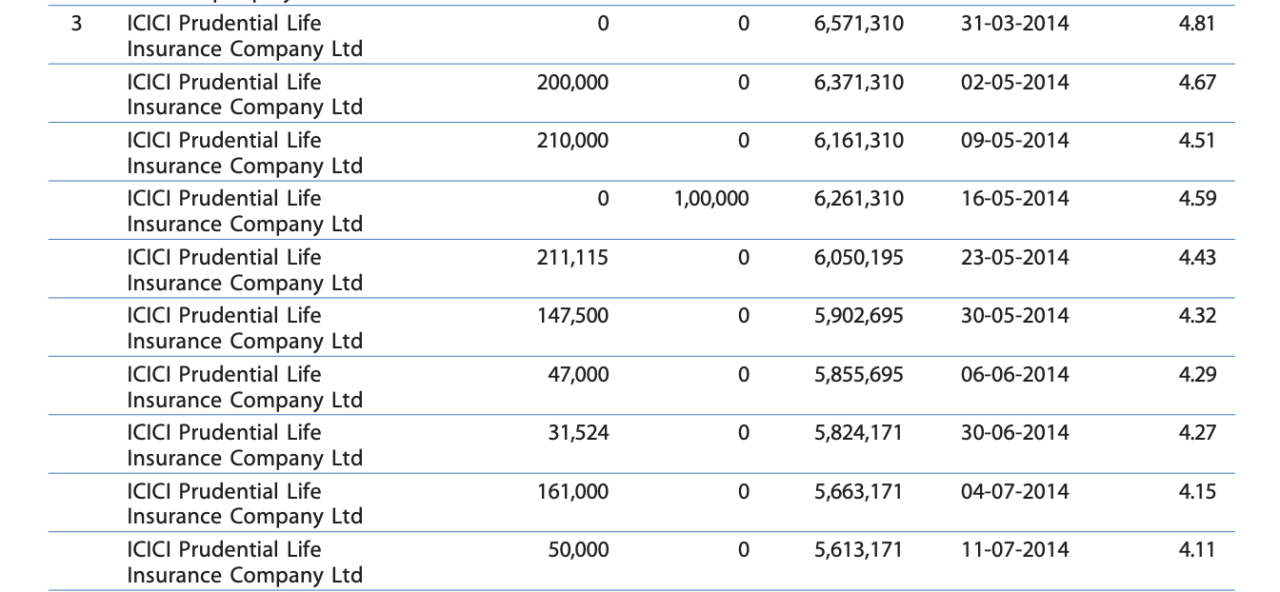
Why fund managers Miss it?
The next & Quite paradoxical question is that how do fund managers miss such window dressing?
Notice in the same period where the general business performance was serially falling down. But ICICI prudential life insurance company has in fact increased its holding from 4.11 to 4.81% holding.
Similarly look at edelweiss securities which increasing its holding during the same period.
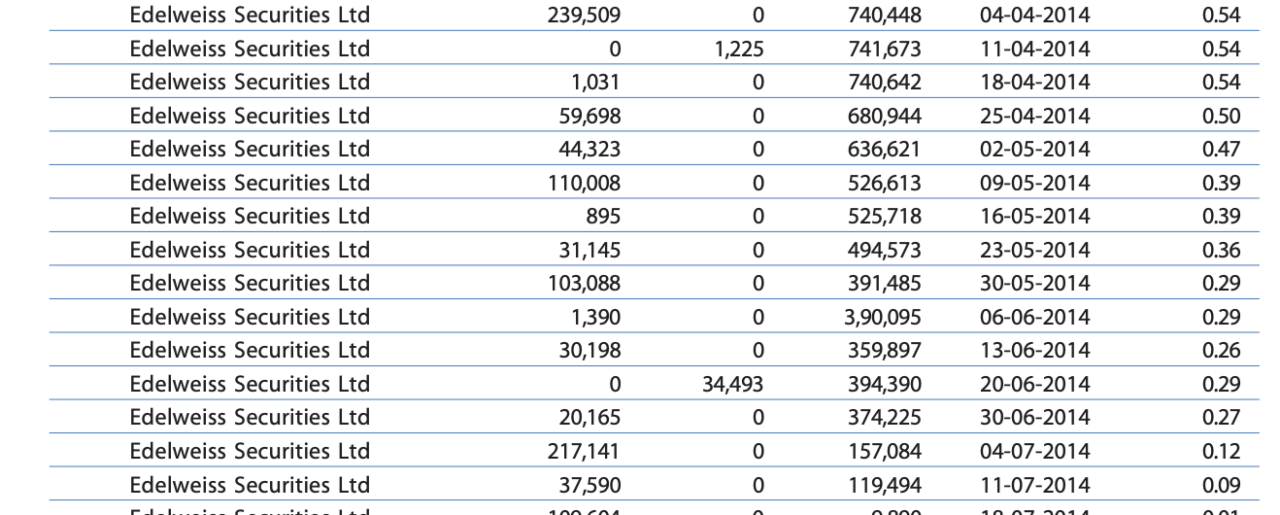
This is How they missed it
During 2014 market rally the stock outperformed, so the funds stepped into do their own investment window dressing. So short term performance and greed can make even the fund managers loose their intellect.
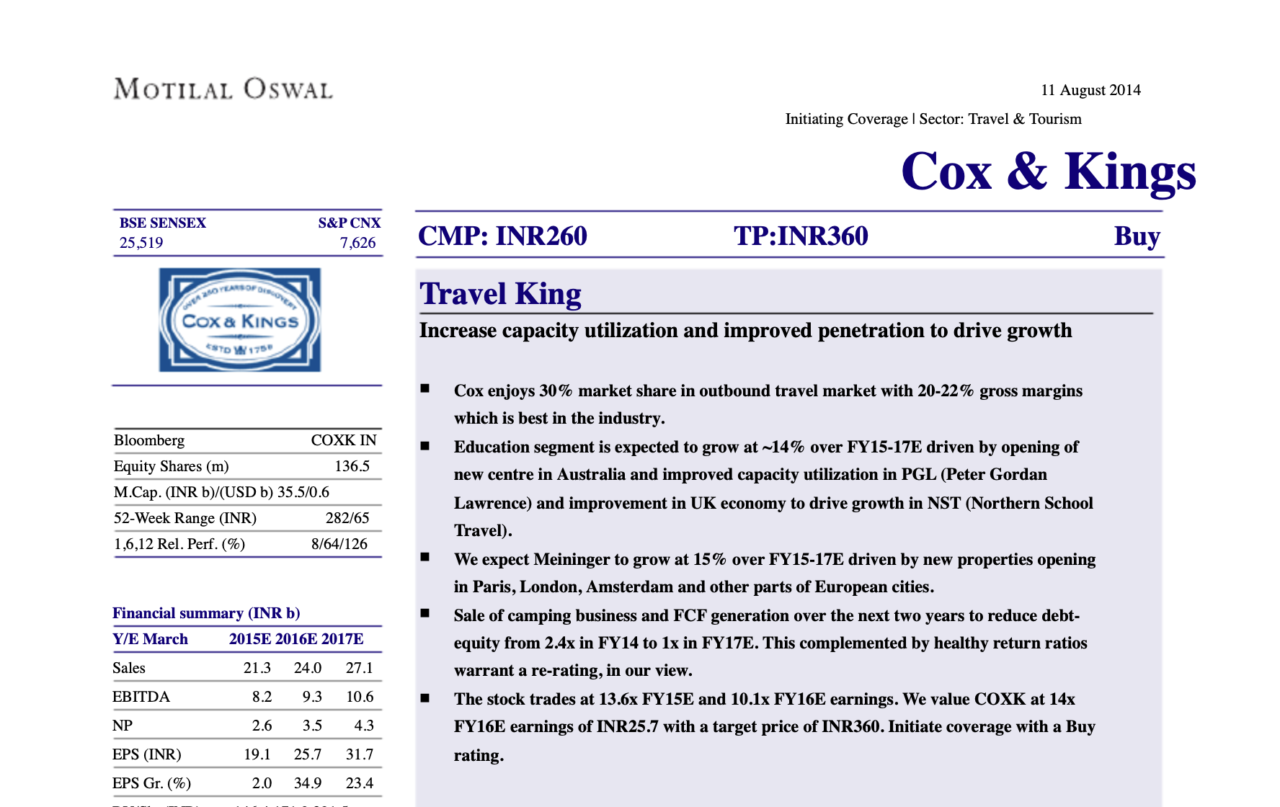
Brokerage House Missed it
In fact check the Motilal Oswal(a popular brokerage house in India)report on Cox and Kings in 2014 reporting period. Where the brokerage has completely lost the idea of fundamental research and instead just publish data upon performing stocks.