Last updated on December 20th, 2025 at 05:29 pm
If you are preparing for that interview and need quick practice with ratio analysis questions. Then you are at the right place. One of the most crucial abilities for anyone pursuing a career in finance, accounting, equities research, corporate strategy, banking, or analytics is practicing ratio analysis.
Ratios assist analysts and students understand company performance, compare firms, gauge profitability, and identify financial concerns by transforming unprocessed financial statements into insightful information. Gaining proficiency in this area lays the groundwork for more senior positions in credit analysis, modeling, valuation, and investment decision-making.
Ratio analysis is not a new concept that is privy to finance; in fact, we calculate ratios.
For Example, Speed is the distance over time, and Rate Per Sq Feet is the price over Space.
The exciting part is these ratios unconsciously do make sense to us, but when it comes to financing, we start to panic.
So let’s take care of that.
I will divide the problems and solutions into five different sections so that you can practice accordingly.
Ratio Analysis Questions
The logic of Ratio Analysis
The trick to remembering and applying ratio analysis is first to understand what the three financial statements tell us.
- Income Statement: Tells us how the business did for a given year, but not necessarily in cash terms.
- Balance Sheet: Paints a picture of the years of performance of the company
- Cash Flow Statement: Converts and shows all the versions in cash.
So if we know what these statements tell us, we can start asking the right questions.
Let me illustrate this for you; let’s say you are concerned about whether a company will survive the debtors in the long term?
Now, the first step is to divide that question into parts
- Survive
- Long Term
- Debtors
As soon as we say survive, we mean the ability to repay the debt, which relates to the income statement and balance sheet.
So naturally, the balance sheet alone cannot give us that information because the balance sheet is just as what has happened to date.
Hence we also need to consider the income-generating capacity, the profit and loss statement.

Moving on from the statements, we need to ask what line item or value to use?
The answer is that since EBIT is used to pay interest, we use EBIT as the capacity proxy.
So, that’s how you need to think.
I would strongly advise against remembering the formula because then logic flies from the window.
Ratio analysis questions and answers formula cheat sheet!
Why practice ratio analysis questions?
Ratio analysis teaches students to think holistically by making connections between cash flows, balance sheets, and income statements. Students can benchmark competitors, recognize trends, spot warning signs, and evaluate the general health of a business with consistent practice. Ratios are utilized in almost all financial models, due-diligence reports, investor presentations, and valuations because they reduce complicated data into understandable measurements.
Core ratio categories
Liquidity Ratios – measure a company’s short-term cash position and ability to meet immediate obligations.
Common ratios: Current Ratio, Quick (Acid-Test) Ratio, Cash Ratio.
Liquidity ratio shows solvency over 12 months and is critical for creditors and working-capital management.
Current Ratio = Current Assets / Current Liabilities
Example: If a company has ₹50,000 in current assets and ₹25,000 in current liabilities,
Current Ratio = 2.0, showing strong short-term liquidity.
Profitability Ratios – assess how efficiently a company converts sales into profit and returns capital to owners.
Common ratios: Gross Margin, Operating Margin, Net Profit Margin, Return on Assets (ROA), Return on Equity (ROE).This indicates pricing power, cost control and long-term viability for investors.
Net Profit Margin = Net Profit / Revenue
Example: A firm earns ₹10 lakh profit from ₹1 crore revenue.
Net Profit Margin = 10%, showing efficiency in generating profit from sales.
Solvency (Leverage) Ratios – evaluate long-term financial stability and debt burden relative to equity and cash flows.
Common ratios: Debt-to-Equity, Interest Coverage (EBIT/Interest), Debt/EBITDA, Equity Ratio.
Solvency is important for lenders and rating agencies to judge default risk and capital structure resilience.
Debt-to-Equity Ratio = Total Debt / Total Equity
Example: If debt = ₹40 lakh and equity = ₹20 lakh,
D/E = 2.0, meaning the company is highly leveraged.
Efficiency (Activity) Ratios – show how effectively a business uses assets and manages operations.
Common ratios: Inventory Turnover, Receivables (DSO), Payables (DPO), Asset Turnover.
Why it matters: reveals operational bottlenecks, working-capital needs and productivity improvements.
Inventory Turnover = COGS / Average Inventory
Example: If COGS = ₹60 lakh and avg. inventory = ₹10 lakh,
Inventory Turnover = 6 times, meaning the company sells and replenishes inventory six times a year.
Market (Valuation) Ratios – link company fundamentals to market pricing and investor expectations.
Common ratios: Price-to-Earnings (P/E), Price-to-Book (P/B), EV/EBITDA, Dividend Yield.
Valuation used by analysts to value stocks, compare peers, and guide investment decisions.
P/E Ratio = Market Price per Share / Earnings per Share (EPS)
Example: Share price = ₹200, EPS = ₹10
P/E = 20, showing investors are willing to pay 20× earnings for the stock.
Top 20 practice questions (with answers)
Liquidity Ratios Analysis Questions
Do you have the ability, capability to surivive the year?
Simple Defnition of Liquidity
Yes! That’s the simple question we are trying to answer about the company.
You may ask then, why do we have so many types of liquidity ratios then? Well, because there are various ways of surviving the year.
- Cash Ratio: Current Assets/ Current Liability
It’s like saying we would use our daily business assets like inventory, mutual fund investments and cash to pay off short term debtors.
- Quick Ratio: Current Assets – Inventory / Current Liabilties
Can we survive without selling the inventory?
- Cash Ratio: Cash + Short Term Investments/ Current Liabilties
Will we make it with just cash in the bank and some investments?
Now let’s use some problems and solutions.
Questions- 1
All the solutions I have given at the end of each section, for you to refer to.
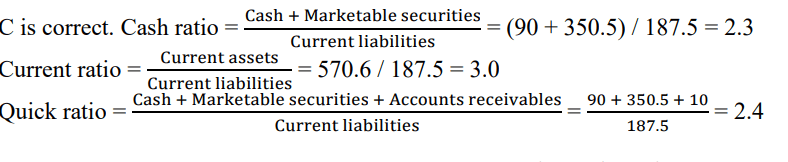
Which of the following ratios decreased between 2011 and 2012?
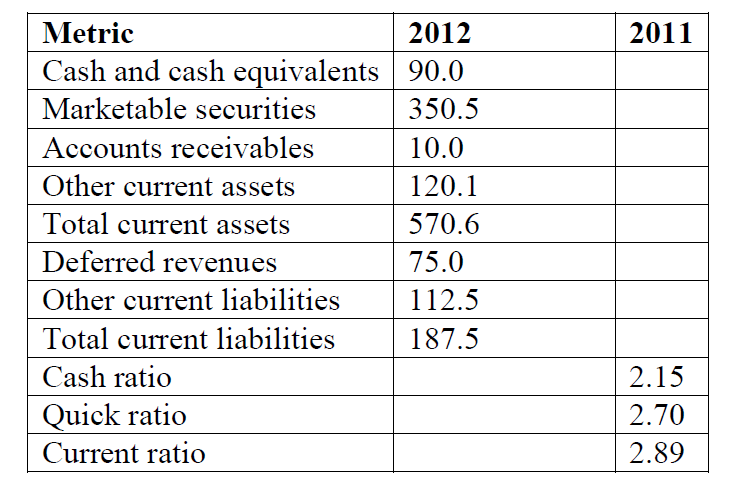
A. Cash.
B. Current.
C. Quick
Questions- 2
The following table shows the balance sheet extract for SQUARE Limited.
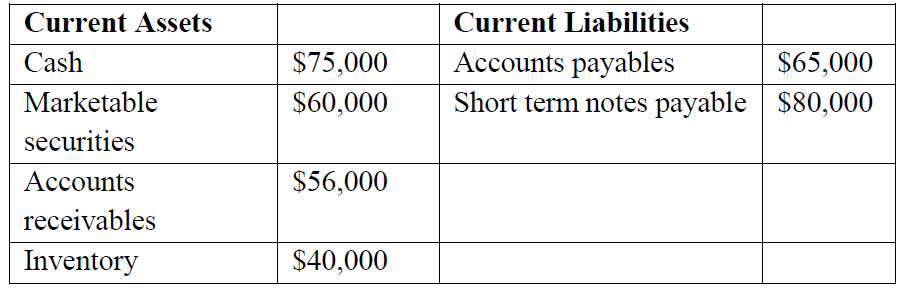
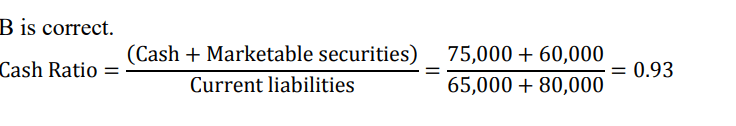
What is the cash ratio for the company?
A. 0.52.
B. 0.93.
C. 1.32.
Questions- 3
Which of the following is least likely correct about the interpretation of liquidity ratios?
A. The quick ratio is more conservative than the current ratio and does not consider inventory.
B. The defensive interval ratio measures how long the company can continue to pay its
expenses from its existing liquid assets.
C. The more extended the cash conversion cycle, the greater the company’s liquidity will be.
Questions- 4
Sans is concerned about whether her business would be able to pay off the long-term
loan obtained by a commercial bank. The ability of her company to meet long-term
obligations are known as:
A. liquidity.
B. profitability.
C. solvency.
Solutions


Question 5:
A company has Current Assets of ₹12,00,000 and Current Liabilities of ₹8,00,000. Inventory is ₹3,00,000.
Calculate Current Ratio and Quick Ratio.
Solution:
Current Ratio = CA / CL = 12,00,000 / 8,00,000 = 1.5
Quick Ratio = (CA – Inventory) / CL = (12,00,000 – 3,00,000) / 8,00,000 = 1.125
Answer: Current Ratio = 1.5, Quick Ratio = 1.13
Solvency Ratio Analysis Questions
What is the risk of going bust, with the long term debtors.
I will clarify here that debt is not bad!
MoreoverThat’s the usual understanding, due to the lack of knowledge of finance.
There would be no big companies like Reliance, Tata, or Indigo if there were no use for debt.
So, what is our intent of finding solvency rations then?
Firstly, it is to see if there are enough resources to support the debt and secondly, does the business has the grit to perform.
The Main Solvency Rations:
- Debt to Equity: Debt/ (Retained Earnings+ Contributed Capital)
This ratio is just benchmarking the number of debt times the equity.
Therefore the interpretation also flows like if it’s more than one times the equity, then we are banking on future performance.
- Assets/ Equity: Total Assets/ (Retained Earnings + Contributed Capital)
This is looking at debt from an indirect angle, like how many times are assets to total equity.
Hence, if the company uses a lot of debt, the Assets/ Equity value should be high.
- Interest Coverage Ratio: EBIT/ Interest
More to do, with the operations side of leverage, the Interest coverage ratio is looking at how many times is your operating profit compared to the cost of debt.
The benchmark is, higher the better.
Solvency Ratio Analysis
Questions- 1
Clark is a credit analyst. He is evaluating the solvency of NYC Public Limited. The
The following balance sheet extract is made use of for this analysis.
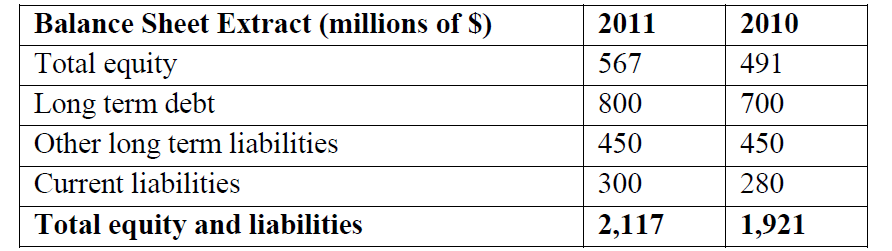
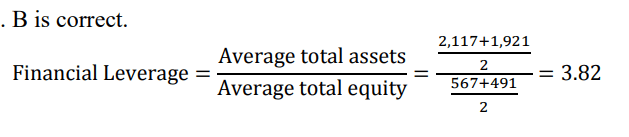
What is the average financial leverage of the company for 2011?
A. 3.73.
B. 3.82.
C. 3.97
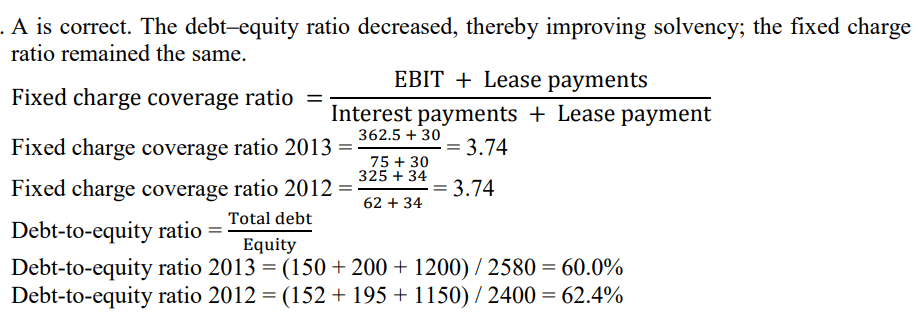
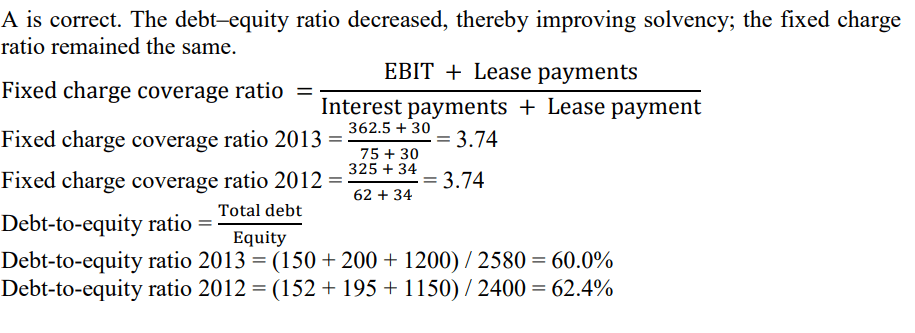
Questions- 2
The following information (in millions) for a company is available:
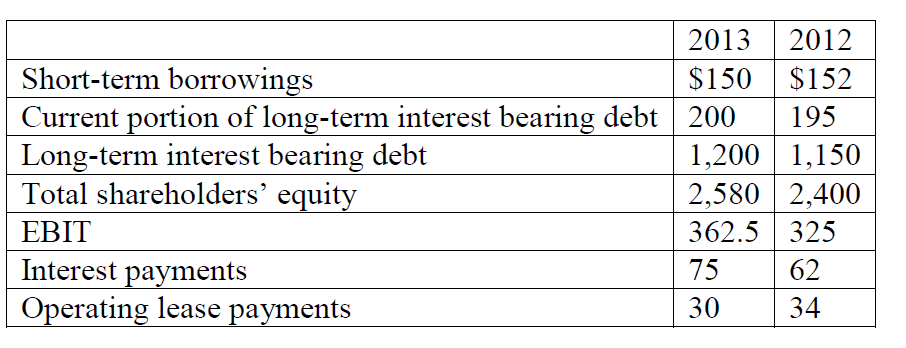
What is the most appropriate conclusion an analyst can make about the solvency of the
Company? Solvency has:
A. improved because the debt-to-equity ratio decreased.
B. deteriorated because the debt-to-equity ratio increased.
C. improved because the fixed charge coverage ratio increased.
Solutions
Questions 3:
Q3. A company has total debt of ₹40 crore and equity of ₹20 crore. What is its Debt-to-Equity ratio? Is it risky?
Answer:
Debt-to-Equity = 40 / 20 = 2.0
A D/E of 2 indicates high leverage. Whether it’s risky depends on the industry, capital-intensive sectors tolerate higher D/E, but for service companies it’s a red flag.
Question 4:
Q4. A firm reports EBIT of ₹15 crore, interest expense of ₹3 crore, and principal repayment of ₹2 crore. What is its Interest Coverage Ratio (ICR)?
Answer:
ICR = EBIT / Interest = 15 / 3 = 5.0×
An interest coverage of 5× indicates strong ability to service debt. Banks typically prefer ≥2× for lending.
Q5. Company A has Total Assets of ₹100 crore and Total Liabilities of ₹70 crore. Calculate its Equity Ratio and interpret it.
Answer:
Equity Ratio = Equity / Assets = (100 – 70) / 100 = 0.30 (30%)
Only 30% of the company is financed by shareholders; 70% is funded through liabilities. This suggests higher financial risk.
Profitability Ratio Analysis Questions
Be advised that it doesn’t necessarily mean in cash when we say profitability.
Hence a company can be very profitable when we look at its income statement, but the reality might be quite different.
You might be interested in reading my article: The Notorious Use of Accounting Principles
Firstly, let me spell out the framework of these ratios, and then we can dive into explanations.
So, profitability ratios can be segregated into the major thought process;
- Firstly, Margins
- Secondly, Returns
In other words, on one side, we are looking at only the income statement with the margin rations.
However, on the other side, with return ratios, moreover using both the income statement and balance sheet.
- EBITDA Margin: Which is Earning before Interest Tax Depreciation/ Revenue.
- EBIT Margin: Similar to EBITDA Margin, but without depreciation.
- PAT Margin: Net Profit / Revenue
- Gross Profit Margin: Gross Profit/ Revenue
Above all, the most common feature of the margin ratios is that the denominator is always revenue.
Contrary to the margin ratios, return ratios are trying to find the benefit accrued to the investor in the business.
You should be noted that I am not referring to stock market returns but business returns.
Subsequently, below are the important return ratios;
- Return on Equity: Net Income/ Total Equity
- ROC: EBIT/ Total Capital
- Return on Assets: Net Income/ Total Assets
Profitability Ratio Analysis Questions 1
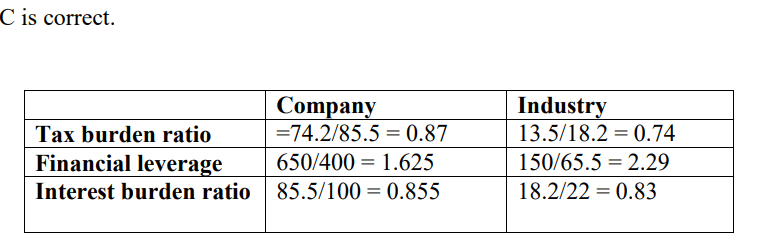
Selected information for a company and the standard size data for its industry are provided
below:
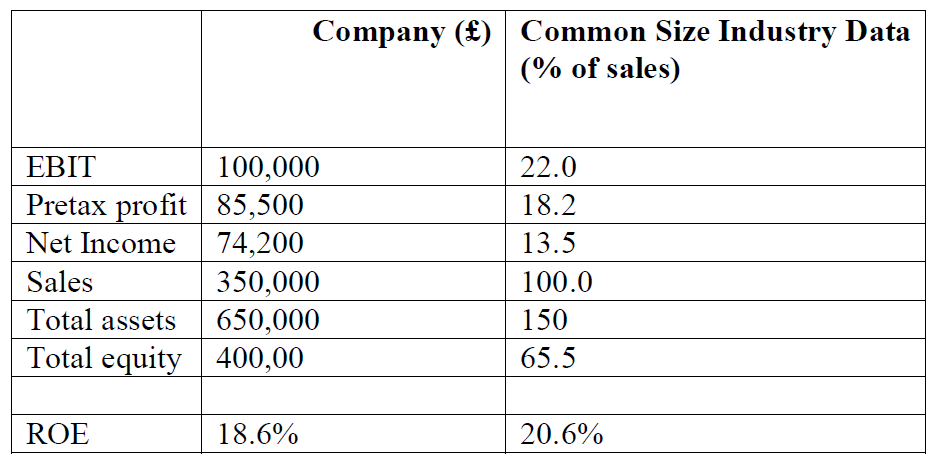
The company’s inferior ROE compared to that of the industry is most likely due to its:
A. tax burden ratio.
B. interest burden ratio.
C. financial leverage ratio
Profitability Ratio Analysis Questions 2
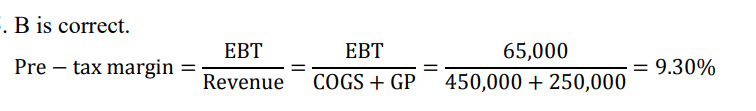
The balance sheet extract for Silver Linings Limited is as follows:
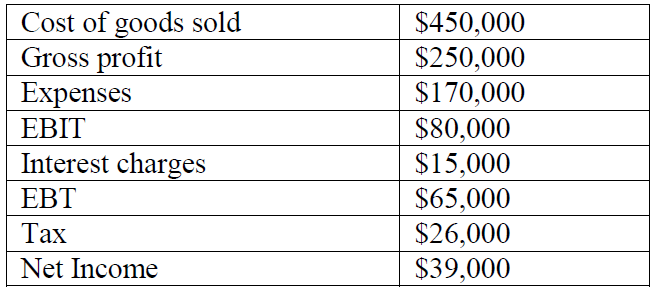
What is the pre-tax margin for the company?
A. 3.7%.
B. 9.3%.
C. 14.4%.
Profitability Ratio Analysis Questions 3
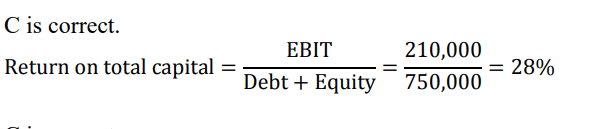
Rob Westfield is an analyst. He gathers the following information for Panama Country Club.
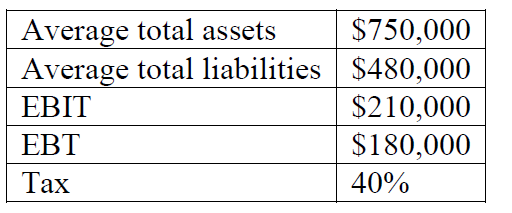
Which of the following statements is least likely correct?
A. The return on assets is 14.4%.
B. The return on equity is 40.0%.
C. The return on total capital is 66.7%.
Solutions
Question 4:
A company has Sales of ₹50,00,000 and Net Profit of ₹5,00,000. What is its Net Profit Margin?
Formula: Net Profit Margin = (Net Profit / Sales) × 100
Answer: (5,00,000 / 50,00,000) × 100 = 10%
Interpretation: The company earns ₹10 profit on every ₹100 of sales.
Question 5:
A firm reports EBIT of ₹12,00,000 and Total Assets of ₹60,00,000. Calculate ROA.
Formula: ROA = (EBIT / Total Assets) × 100
Answer: (12,00,000 / 60,00,000) × 100 = 20%
Interpretation: The firm generates 20% return on every rupee invested in assets.
Activity Ratio
Unlike the ratios discussed until now, activity ratios try to dig deeper into a company’s operations.
Moreover, activity ratios are completely basis, inter financial statement calculations.
- Inventory Turnover: Cost of Goods Sold/ Inventory
This ratio tries to find how many times the inventory is sold compared to the total inventory.
- Receivables Turnover:
Just like the ratio on inventory, the receivables turnover ratio finds the ratio of sales to total receivables.
- Payables Turnover
Similarly, the payables turnover ratio finds the ratio of the cost of goods sold to the total creditors.
Subsequently, it should be evident that inventory turnover should be high, receivables turnover should be low, and payables turnover should be increased.
Activity Ratio Questions 1
Selected information from a company’s comparative income statements and balance sheets is
presented below:
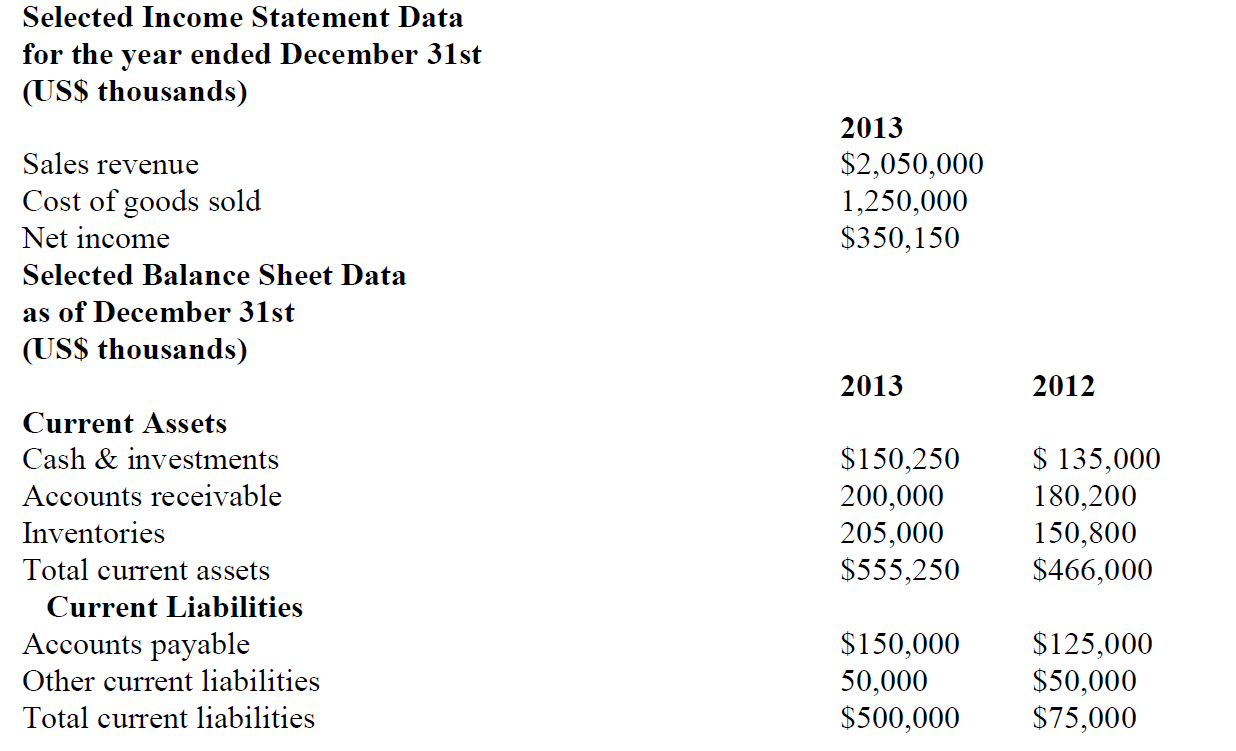
The company operates in an industry in which suppliers offer terms of 2/10, net 30. The
payables turnover for the average company in the industry is 8.5 times. Which of the
is the following statements the most accurate? In 2013, the company, on average:
A. took advantage of early payment discounts.
B. paid its accounts within the payment terms provisionally
C. paid its accounts more promptly than the average firm in the industry.
Solution
Conclusion
One of the most powerful techniques for understanding a company's financial health is ratio analysis, which is also one of the most frequently evaluated skills in finance interviews. The ability to calculate, interpret, and explain liquidity, profitability, solvency, efficiency, and market ratios clearly sets you apart from other applicants, regardless of whether you are pursuing jobs in equity research, corporate finance, credit analysis, banking, FP&A, or investment management.
This article has offered a thorough, placement-focused framework that includes basic ratio classifications, formulas, and quantitative exercises in addition to interview-level questions and responses that are carefully crafted to improve accuracy and confidence. Regular practice of these activities helps students develop the analytical profundity and speed that are essential for navigating real-world financial interviews.
Next Step: Continue practicing more quantitative questions, review real yearly reports, and create a customized reference manual. You will approach your interviews with clarity, confidence, and a tactical edge if you put up consistent effort and do the necessary prepared steps.
Turn Your Ratio Analysis Skills Into Job-Ready Financial Modelling Expertise
Interviewers don’t just ask ratios, they test your ability to interpret numbers, build models, and make decisions.
That’s exactly what Mentor Me Careers trains you for.
Enroll in the Financial Modelling & Valuation Course
You’ll learn:
1.Building 3-statement financial models
2.Forecasting revenues, margins & cash flows
3.Performing valuation (DCF, Comps, Transaction Multiples)
4.Solving modelling tests used by banks & consulting firms
5.Presenting insights like a real analyst
6.Excel shortcuts & analytics frameworks
Perfect for: Finance interviews, equity research, IB, consulting, FP&A, credit roles.
FAQ
Examples include liquidity ratios (Current Ratio, Quick Ratio), profitability ratios (Net Profit Margin, ROE, ROA), solvency ratios (Debt-to-Equity, Interest Coverage), efficiency ratios (Inventory Turnover, Asset Turnover), and market ratios (P/E Ratio, EPS, Dividend Yield).
The five core ratio categories are:
1.Liquidity Ratios – assess short-term solvency
2.Profitability Ratios – measure ability to generate profit
3.Leverage/Solvency Ratios – evaluate long-term debt structure
4.Efficiency/Activity Ratios – measure asset utilization
5.Market Ratios – analyse market-based performance
The golden ratio (not an accounting ratio) is a mathematical constant φ ≈ 1.618, often seen in nature, art, and design. It is not used in financial ratio analysis but may be asked to test conceptual clarity.
Common questions include:
1.Calculate Current Ratio / Quick Ratio
2.Compute Profit Margin, ROE, ROA
3.Determine Debt-to-Equity or Interest Coverage
4.Interpret P/E Ratio or EPS
5.Analyse a company’s liquidity or profitability based on given data
6.Compare ratios across years or competitors
For Banks:
1.Capital Adequacy Ratio (CAR)
2.Net Interest Margin (NIM)
3.Cost-to-Income Ratio
4.Gross/Net NPA Ratios
5.Credit-to-Deposit Ratio
For Manufacturing:
1.Inventory Turnover
2.Asset Turnover
3.Operating Margin
4.Debt-to-Equity
5.Return on Capital Employed (ROCE)
You can automate ratios by using cell-linked formulas such as:
=CurrentAssets/CurrentLiabilities
=NetIncome/Sales
=TotalDebt/Equity
Create a financial model template where raw financial statements are pasted, and ratios update automatically. Use Excel tools like Named Ranges, PivotTables, Data Validation, and Financial Modelling templates for faster processing.
