Last updated on October 23rd, 2024 at 02:49 pm
DSO full form stands for days of sales outstanding and is a measure of a company’s ability to collect cash from its customers.
I was analysing a company with great revenues and great margins but with no cash!
How is that possible?
Well, it’s quite possible and let’s explore this in-depth.
So, what is the full form of DSO?
DSO full form stands for the number of days of sales outstanding and is a metric used in financial analysis to compare the effectiveness of a company to collect payments.
Key Takeaways on DSO
-DSO is the ratio of Average recivables over sales
-DSO means the days to collect the outstanding cash.
-It is used to compare a company’s cash flow
-Higer DSO numbers usually mean poor cash flow situation
– Lower DSO number may also sometimes be due to industry dynamics.
Quick Overview On DSO Full form-Days of Sales Outstanding
Now, I’ll complete the first statement I made at the start!
A company with healthy revenue and net profit but missing cash will most likely send an analyst into perplexed trance mode.
However, there can be many reasons for the cash not turning up on the balance sheet, but most likely, there could be two major ones;
- Your company in question is not able to collect the cash
- Maybe the company use using some creative accounting tactic to inflate profits.
Both of these are some serious issues, and If I was the analyst would raise my eyebrows!

Under ideal, happy and honest conditions, the company should sell the goods and collect cash!
How difficult is that to do?
However, let’s be honest, not all thieves are usually convicted of fraud because not all tactics might attract the attention of law enforcement.
DSO in simple language trying to figure of the amount of sales done by the company is actually still not collected in cash.
Allen Aravindan
DSO Formula and Use
Now before I start hammering this article with the DSO formula and getting lost in the calculation.
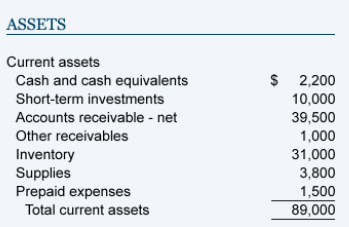
First, let’s understand the linkages of various accounts in the balance sheet and income statement.
- Any sales done in cash goes to – Balance sheet cash
- Secondly, sales not done in cash goes to-Accounts receivable in the balance sheet.
Of course, both are going to the balance sheet and on the asset side.
So, I am not really worried about the sales that are collected in cash, but I am definitely worried about the one which will be collected in the future.
The future is the future, what is today matters more to analyse
Analyst Conversation
DSO Formula
So, I now want to find out how much on average the;
- Sales not collected in cash versus the total sales made
Hence, just a proportion to begin with.
Firstly, don’t worry too much about the word credit sales, because that means just sales /revenue.
In conclusion, it means how much is accounts receivable a proportion of sales which gives us a % and then multiply that with 365 days.
Essentially we are converting the percentage into a different format of days.
Quick Example here:
Let’s say I was running a business, and I sold $5000 worth of goods, which generated cash of $2500.
So, applying the proportionate logic here means 50% is not collected.
Converting into days: 50% of 365 = 182 Days.
How simple was that?
How to interpret the ratio?
Now, merely calculating the DSO and saying that we found the mole.
Firstly, count your eggs before they hatch!
Secondly, they are not living up to the Sherlock home standards!

So, then how do we really interpret it?
- Which industry does the company operate in?
- What is the history of the company’s DSO?
- Is there a significant change over time?
These questions are important because we do want to ignore the bad ones but not lose out on the stars.
Here is a simple example to show why the context is so important.
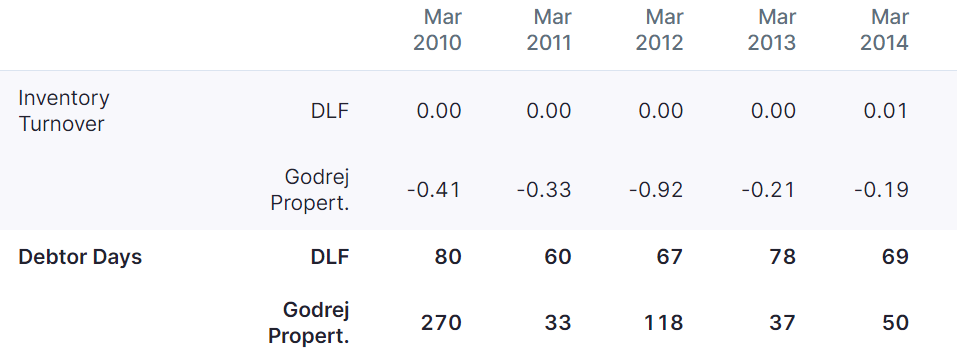
Look at the debtor days, which is the same as DSO for Godrej versus DLF.
Notice that in the real estate industry, DSO can’t be expected to be zero but hovers around the 40-50 range.
Moreover, let’s look at the IT services industry.
So, are you expecting the DSO to be zero?
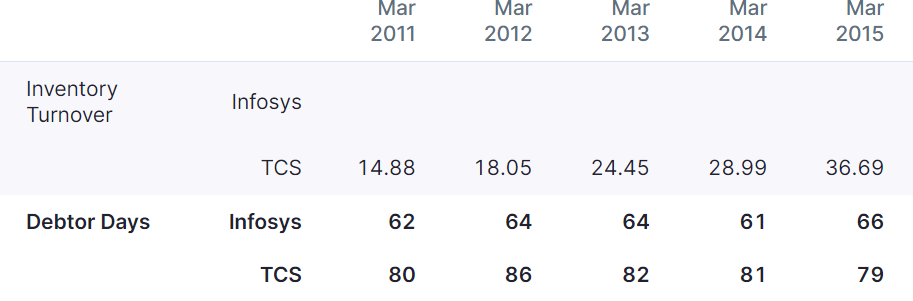
The numbers do suggest that even the service industry can have some lag in cash collection but are these companies bad?
Of course not; in fact, Infosys and TCS are the Sachin Tendulkar and Virat Kohli’s of the stock market!
Is there a good or bad DSO?
My plain answer is no because good and bad are relative terms, which we have already discussed above.

Look at the DSO numbers of these two really good companies in aviation in India.
So, under the good and bad scheme, these DSO numbers should be excellent, right?
However, the aviation industry works on a zero credit system, which results in the appearance of good work.
Lastly, I’ll conclude this section by saying that industry and peers are the most important aspect of ratios.
Real World Examples
Now, let me jump into some hardcore analysis without the bits-and-pieces approach.

So, this is my objective;
- I want to invest a large sum of capital to generate capital appreciation.
That’s a sophisticated way of an investment banker saying;
“Show me the money”
- Second, I want to invest in high cash-rich and cash-flow companies.
- Finally, I want them to have a consistent past.
Now, that’s a real problem to solve, which needs some good analysis.
Step 1: Filter the Sectors
Since I want to invest in cash rich companies with consistent cash flows.
So I have to look at the correct sector right.
Hence the sectors with cash-rich traits are as follows to name:
- FMCG
- Aviation
- Consumer electronics
- Automobiles
- E-commerce
Now, don’t overthink this because I just used my own imagination to find businesses which get paid instantly.
However, we can’t really analyse all the sectors, so let’s focus on consumer durables and Aviation.
Step 2: Filter the data
Now, it’s time to filter the data and come to some names with good DSO numbers and high cash flows.
I have downloaded and created a template for this analysis, which you can use.
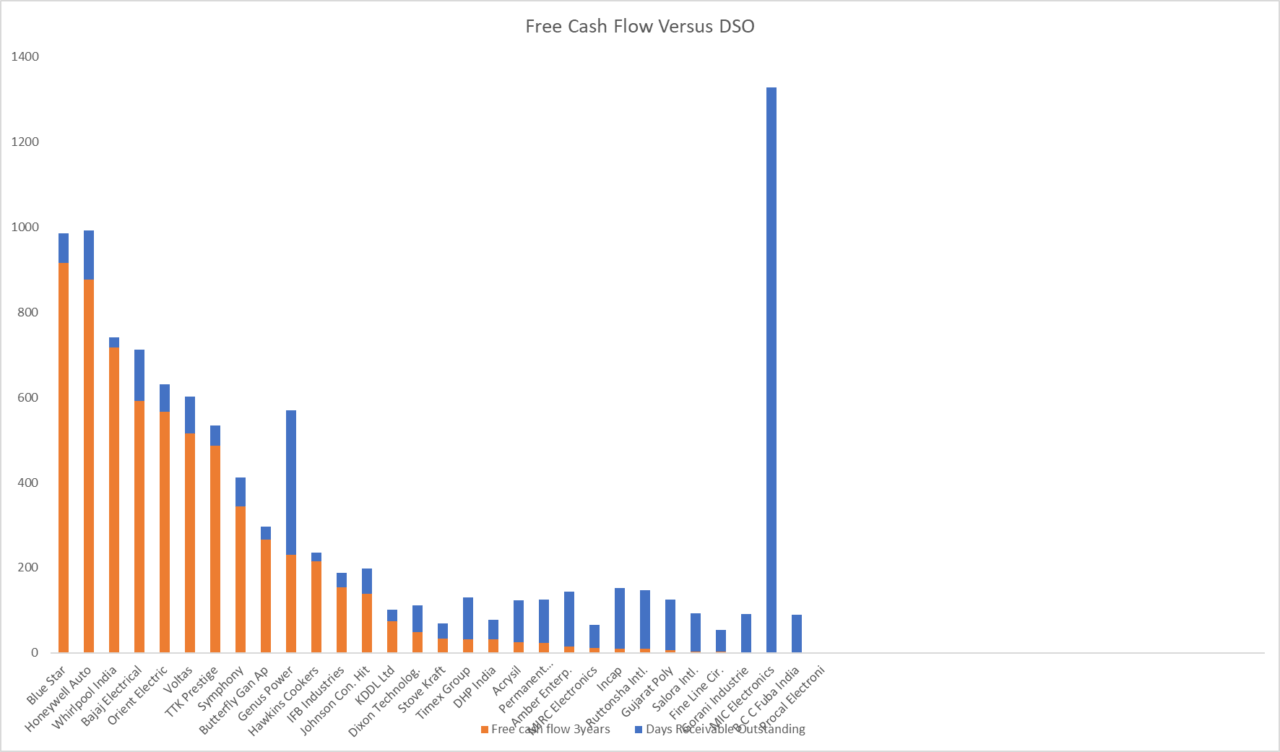
So, in the case of the consumer durable segment, the blue star clearly is the winner.
The company has the highest 3 Year cash flows and lowest days of sales outstanding.
An insight here is that companies with higher running cashflows, also automatically have lower DSO.
Moreover, the situation is not very different in aviation too.
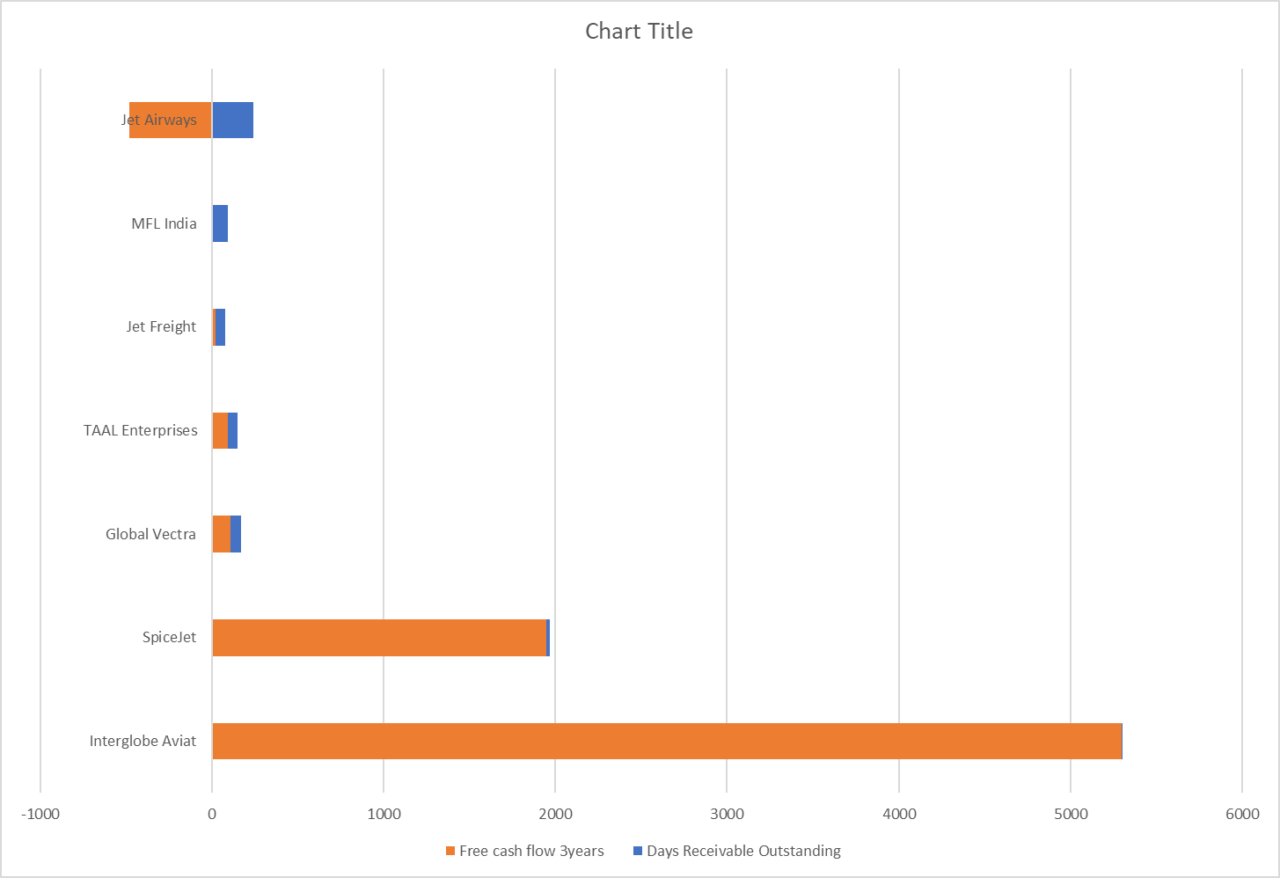
Interglobe(Indigo airlines) has the highest 3-year cash flows with the lowest DSO.
Even if the industry already has the trait of lower DSO.
Step 3: Finalise 2 Companies for further analysis
Now, it’s foolish to stop at DSO and free cash flow.
We need to still pick the names, but it’s not necessary that we will pick blue star and indigo in their respective sectors.
There could be multiple other factors which are not visible for now.
For example: On further analysis, this is what complicates matters further
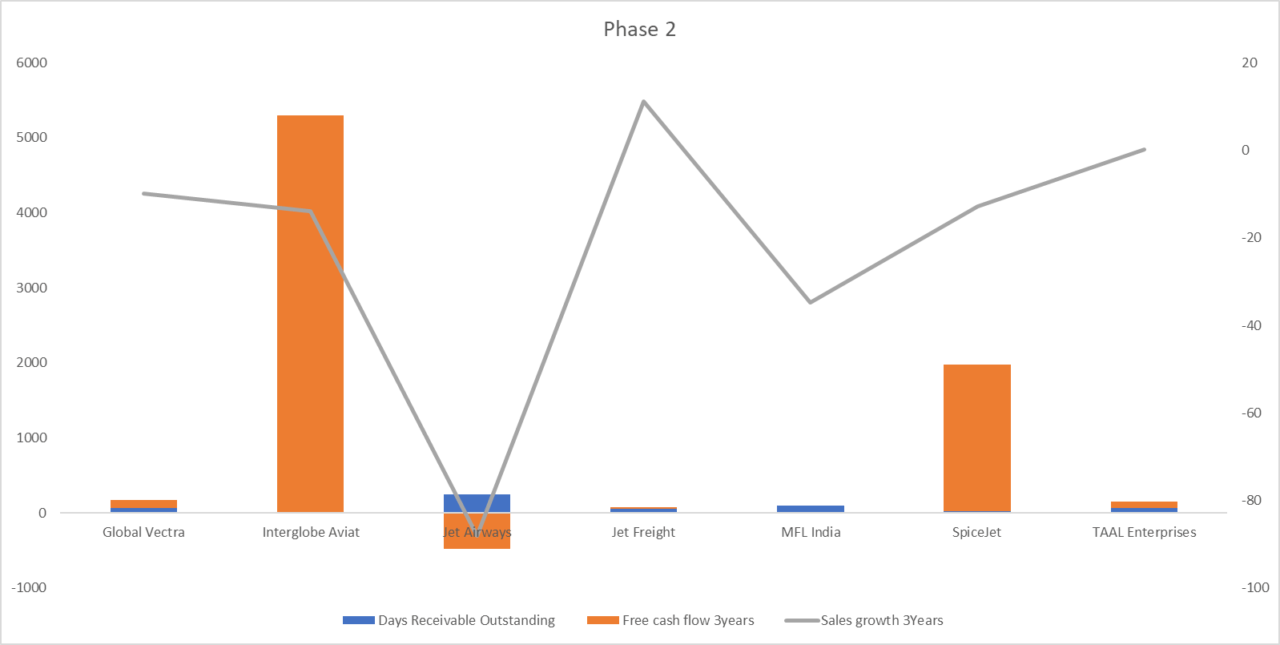
Moreover, now the interesting scenario that is created is:
- Spicejet has had a better sales growth rate for the last three years compared to Interglobe
- Also, Interglobe has high debt versus Spicejet, which has almost zero debt.
- Lastly, an exceptional case of Jet freight where has shown a high sales growth rate.
In conclusion, without extending this discussion, the point to be made is that you should take ratios with a spoon of salt.
Exceptional Cases
These are industries which are bound to have higher DSOs because of the business dynamics.
For example, Construction or infra-based companies have a long wait time.
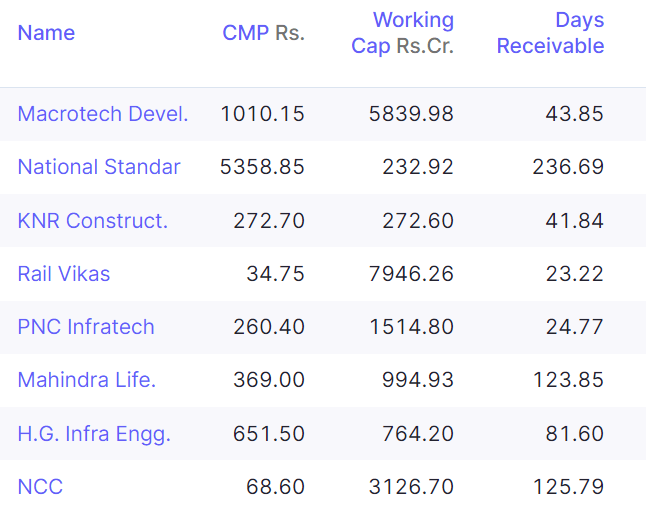
Moreover, there is also the added element of accounting principles, which can make these ratios inflate.
For example, construction business’s don’t use the common revenue recognition method, instead, they might use methods like
- Percentage completion method
- Cost recovery
- Completed Contract method
Which, by the way, is unlike saying that a person paid me cash today or not.
How on earth can we use that principle when the construction of a highway might take 5 years to complete?
So the principle used in such cases relates to the completion of the project itself.
Now that would naturally show higher sales and receivables which doesn’t mean the company is bad.
Conclusions
I’ll conclude this very long discussion by saying that small things matter in financial analysis.
In my initial years as an investor and analyst, I was tempted to conclude things too quickly.
However, what I have understood with experience, is that the common sense element in the analysis should be 95%, along with 5% of tools like ratios.
You may want to check out my financial analysis course and also another article related to inventory scams.
Ciao!
A CFA charterholder with hands-on experience across investment analysis and finance education. At MentorMeCareers, he writes and reviews content on CFA, financial modeling, and investment banking careers — grounded in real market data rather than generic advice, and shaped by what actually helps candidates and professionals succeed.

