Last updated on December 29th, 2025 at 01:03 pm
The Average Collection Period indicates how long, on average, a company needs to collect cash from customers following a credit sale. This metric is crucial for evaluating a company’s efficiency in managing receivables, understanding its cash flow, and assessing its credit control practices. It’s a key element in both corporate finance and financial analysis.

What is the Average Collection Period?
The average collection period is the amount of time passed before a company collects its accounts receivable. It refers to the time taken on average for the company to receive payments it is owed from clients or customers.
The company ensures to monitor the average collection period so that they have enough cash available to take care of their financial responsibilities.
In simple terms, the average collection period is a calculation of the average number of days between the date a sale is made and the date the buyer submits the payment or the date that the company receives the payment from the buyer.
The average collection period is important as it helps the company handle their expenses more efficiently. The annual collection period is calculated by dividing a company’s yearly accounts balance by its yearly total sales. This figure is then multiplied by 365(no. of days) to generate a number of days.
Alternate Formula (Using Receivables Turnover)
Receivables Turnover shows how many times receivables are collected in a year. A higher turnover means faster collections, which results in a lower average collection period. On the other hand, a lower turnover implies slower collections and a higher collection period.
Formula:
Average Collection Period = 365 ÷ Receivables Turnover
Importance of the Average Collection Period
Maintain liquidity
Maintaining the liquidity of the company is a crucial task. It is important that the company receives payment for the goods and services offered in a timely manner. This allows the company to maintain a level of liquidity. This allows the company to pay for immediate expenses and to get a general idea of when it may be capable of making large expenses.
Planning for potential expenditures and future expenditures
Average collection period future is important to help a company prepare an effective plan for covering costs and scheduling potential future expenditures. As it is very obvious, the lower the average collection period, the better it is for the company. This means that the client will take less time to pay their bills. In this way, the company collects their payments in a faster way. However, this fast collection method may not always prove to be beneficial for the company. This can lead to some customers choosing other companies with the same goods and services that have more lenient payment rules or better payment options.
The average collection period is calculated in days. The company must include in days. The company must also calculate its average balance of accounts receivable for the year and divide it by total net sales for the year.
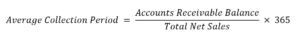
Average Collection Period Formula
Let’s take an example. Company ABC recorded a yearly accounts receivable balance of $25,000. In the same year, the company logged $200,000 in total net sales.
Solution:
The first step to determining the company’s average collection period is to divide $25,000 by $200,000. The quotient, then, must be multiplied by 365 because the calculation is to determine the average collection period for the year. For our example, the average collection period calculation looks like the one below:
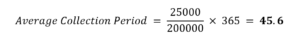
This means that the company’s average collection period for the year is about 46 days.
How to Calculate Average Collection Period (Step-by-Step)
The Average Collection Period (ACP) shows how many days, on average, a company takes to collect cash from its customers after making a credit sale. A lower ACP indicates faster collections and better cash flow.
Step 1: Find Average Accounts Receivable
Add the opening and closing accounts receivable balances and divide by two.
Formula:
Average Accounts Receivable = (Opening Receivables + Closing Receivables) ÷ 2
This smooths out fluctuations during the year and gives a more accurate picture.
Step 2: Identify Net Credit Sales
Use net credit sales, not total sales.
Net credit sales = Total credit sales minus returns, discounts, and allowances.
If credit sales are not given, analysts often use total sales as an approximation
Step 3: Apply the Average Collection Period Formula
Now plug the values into the formula:
Average Collection Period = (Average Accounts Receivable ÷ Net Credit Sales) × 365
This converts the ratio into the number of days, making it easier to interpret.
Step 4: Interpret the Result
Lower ACP – Faster collections, stronger liquidity, efficient credit control
Higher ACP – Slower collections, potential cash-flow issues, weak receivables management
Always compare the result with:
Company’s credit policy
Industry average
Previous years’ ACP
Impact on Financial Statements
The average collection period also affects the company’s balance sheet and cash flow statements. A shorter collection period improves the accounts receivable turnover ratio, indicating efficient credit and collection practices. Conversely, a longer collection period might highlight potential issues with credit terms and payment collection processes.
Average Collection Period Examples
Example 1 – Simple Accounting Example (Exam-Style)
Question:
A company has average accounts receivable of ₹5,00,000 and net credit sales of ₹36,50,000 during the year. Calculate the Average Collection Period.
Solution:
Average Collection Period = (Average Accounts Receivable ÷ Net Credit Sales) × 365
= (₹5,00,000 ÷ ₹36,50,000) × 365
= 50 days
Answer:
The company takes 50 days on average to collect cash from customers.
Interpretation:
A 50-day collection period indicates moderate credit efficiency. Faster collection would improve liquidity.
Example 2 – Business Interpretation Example
Scenario:
A company’s credit policy allows 30 days for customer payment.
Its calculated Average Collection Period is 55 days.
Interpretation:
Customers are paying 25 days later than allowed.
This signals weak credit control or poor follow-up.
Cash is locked in receivables, increasing working capital pressure.
Business Impact:
The firm may face liquidity issues and should tighten credit terms, improve collection efforts, or review customer creditworthiness.
Example 3 – Using Receivables Turnover
Question:
A company has a receivables turnover ratio of 8 times. Calculate the Average Collection Period.
Solution:
Average Collection Period = 365 ÷ Receivables Turnover
= 365 ÷ 8
= 45.6 days 46 days)
Answer:
The company collects receivables in about 46 days.
Interpretation:
A turnover of 8 times reflects efficient receivables management, especially if the credit period is close to 45 days.
Interpretation of Average Collection Period
The average collection period (ACP) measures how long, on average, it takes a company to collect payment from its credit customers.
It is usually expressed in days.
What a Low Collection Period Indicates
A low average collection period means the company collects payments quickly after making sales on credit.
This generally suggests:
Strong credit policies
Efficient collection processes
Better short-term liquidity
More cash available for operations
Example: If ACP is 20 days, the company collects receivables quickly good for cash flow.
What a High Collection Period Indicates
A high average collection period means it takes longer for the company to collect payments from its customers.
This could signal:
Lenient or poorly enforced credit terms
Possible collection problems or bad debts
Liquidity pressure (less cash on hand)
Greater risk from slow-paying customers
Example: If ACP is 90 days, the company waits 3 months on average to get paid which can strain cash flow.
Link to Liquidity and Cash Flow Impact
Liquidity refers to a company’s ability to meet short-term obligations (like paying suppliers, salaries, interest).
Cash flow is the actual inflow and outflow of money.
Low ACP – positive cash flow
Because cash arrives sooner, the business can reinvest, pay bills on time, and avoid borrowing.
High ACP – negative cash flow pressure
Funds are tied up in receivables longer, which can force the company to borrow or delay payments.
In other words: Average Collection Period directly affects working capital and liquidity.
Faster collections = stronger liquidity → better financial health.
Good vs Poor Collection Period
| Collection Days | Interpretation | Liquidity / Cash Flow Impact | Actionable Insight |
| 0–30 days | Excellent | Strong liquidity; low receivables risk | Maintain or optimize credit policy |
| 31–45 days | Good | Healthy cash flow | Monitor for trends |
| 46–60 days | Moderate | Average liquidity; watch cash conversion | Tighten collection follow-up |
| 61–90 days | Weak | Cash flow strain; longer cash conversion cycle | Review credit terms; enforce stricter collections |
| 90+ days | Poor | High risk of bad debts; liquidity pressure | Restructure credit policy; consider credit insurance |
Average Collection Period vs Receivables Turnover
Average Collection Period answers:
“How many days does it take to get paid?”
Receivables Turnover Ratio answers:
“How many times do we collect receivables in a year?”
Lower ACP + Higher Turnover = Strong receivables management
Higher ACP + Lower Turnover = Cash flow and liquidity risk
| Basis of Comparison | Average Collection Period (ACP) | Receivables Turnover Ratio (RTR) |
| Meaning | Measures the average number of days taken to collect cash from credit customers | Measures how many times receivables are collected during a period |
| Unit | Days | Times |
| Formula | (Average Accounts Receivable ÷ Net Credit Sales) × 365 | Net Credit Sales ÷ Average Accounts Receivable |
| Usage | Used by managers to assess collection efficiency and cash flow timing | Used to evaluate speed and effectiveness of credit sales collection |
| Interpretation | Lower value is better as it indicates faster collections | Higher value is better as it indicates quicker conversion of receivables |
| Impact on Liquidity | Directly shows how long cash is blocked in receivables | Indicates how efficiently receivables are turned into cash |
| Common Users | Finance managers, working capital analysts | Accountants, auditors, financial analysts |
| Relationship | Inversely related to receivables turnover | Inversely related to average collection period |
Average Collection Period for Exams & Interviews
Why Interviewers Ask This Ratio
1.Tests understanding of working capital management
2.Shows ability to link accounting numbers with cash flow health
How to Explain It in One Line
“Average collection period measures how many days a company takes to collect cash from its credit customers.”
Common Follow-Up Questions
1.What happens if ACP increases year-on-year?
2.How does ACP affect liquidity?
3.Difference between ACP and receivables turnover?
4.Is a lower ACP always better?
The Average Collection Period is a delightful way to see how well a business gathers its receivables! It’s super important for understanding liquidity, preparing for exams, and shining in finance interviews. Getting the calculation right, interpreting it well, and comparing it to industry standards are all essential for making the most out of this handy ratio!
Integrating Keywords
Cash Flow and Accounts Receivable Turnover Ratio
Monitoring the average collection period is essential for managing cash flow and improving the accounts receivable turnover ratio. A lower average collection period indicates faster cash conversion, enhancing the company’s liquidity and financial stability. Efficient management of accounts receivable directly impacts the balance sheet by reducing the risk of bad debts and improving overall financial health.
Credit Terms and Payment Terms
Balancing the average collection period with favorable credit and payment terms is crucial. While shorter collection periods boost cash flow, they must be balanced against competitive credit terms to retain customers. Offering flexible payment terms can attract clients, but it’s essential to ensure that these terms do not adversely affect the company’s average collection period and overall financial performance.
Conclusion
Understanding and calculating the average collection period is vital for efficient financial management. It provides insights into the company’s credit and collection efficiency, impacting cash flow, liquidity, and overall financial health. By monitoring this metric, businesses can optimize their credit policies, balance sheet, and accounts receivable turnover ratio to maintain financial stability and support sustainable growth.
FAQ
It depends on industry norms, but generally 30–45 days is considered healthy for most B2B firms.
Yes. Average Collection Period and Days Sales Outstanding (DSO) measure the same concept.
No. A negative ACP is not practical and indicates incorrect data.
Loose credit policy, weak follow-ups, slow-paying customers, or poor invoicing systems.
Tighter credit terms, early-payment discounts, faster invoicing, regular follow-ups, and credit checks.
Related Articles
- Ratio analysis problems with solutions
- Financial Statements
- Degree of financial leverage
- What are accounts receivable explained with examples
- Cash equivalents
- Working capital cycle
- Types of liabilities in financial statement
- Forward contracts
- Financial markets questions and answers

