Last updated on March 5th, 2026 at 03:14 pm
If you’ve landed on this page from my YouTube tutorial on Tesla financial model then you’re in the right place.

This article is the written companion to Part 1 of the Tesla financial modeling series, where we build the core revenue engine of a Tesla model from scratch. The Excel template linked from the video is designed to help you follow along and replicate the exact approach—using primary filings + operational disclosures, not shortcuts.
Tesla is one of the most interesting (and most frustrating) companies to model:
- Interesting because it’s not just an auto company—it has Energy and Services/Other revenue streams that can become meaningful over time.
- Frustrating because Tesla often does not disclose many OEM-style operational details that traditional auto models rely on.
So the model needs to be built with a different mindset: build what you can from disclosed facts, then use a market-based framework (EV adoption + regional EV sales + Tesla share) to fill the gaps intelligently. In case you aren’t aware of “What is financial modeling“, then do read this article.
What This Tesla Financial Model Covers (And Why It’s Split Into Parts)
This modeling project is deliberately split into multiple parts because a proper Tesla model is big.
Part 1
- Build the revenue driver engine
- Break Tesla into Automotive / Energy / Services
- Derive unit economics (ex: revenue per vehicle, revenue per GWh)
- Add the market share framework to forecast deliveries bottom-up
Part 2 and Part 3 (later):
- Forecast cost structure, margins, operating leverage
- Build Balance Sheet, working capital, and schedule sheets (PPE, debt, etc.)
- Complete DCF valuation with clean linkages
Why start with revenue? Because everything in a DCF ultimately depends on revenue—growth, margins, reinvestment, free cash flows, valuation. A rushed revenue forecast destroys the credibility of the entire model. If you want to first understand the process of making a financial model then check- how to build a financial model article.
The #1 Rule: Always Pull Tesla Financials From Primary Sources
Before we talk “model,” we talk data hygiene.
For US-listed companies like Tesla, the clean starting point is:
- SEC filings (10-K, 10-Q) via EDGAR
- Tesla’s shareholder decks / investor presentations (especially quarterly)
In the video, I emphasized something I see students do wrong all the time: they pull “summary numbers” from secondary sites and build models on top of that. That’s not modeling—that’s copy-pasting. Thats why most candidates don’t learn this skills properly is because these important aspects are not covered in their respective financial modeling syllabus.
Why EDGAR matters
EDGAR gives you:
- Audited annual report financials (10-K)
- Quarterly updates (10-Q)
- Footnotes and segment disclosures (crucial for Tesla)
You can view filings in HTML (easy to search) or download them.
Tesla Is Not Just “Cars”: Understand The Business Segments First
A Tesla model becomes much easier once you accept this truth:
Tesla revenue is diversified—and each revenue stream behaves differently.
Tesla’s main revenue buckets (model structure)
- Automotive
- Vehicle sales (Model 3/Y, S/X, etc.)
- Automotive leasing
- (Often disclosed separately) regulatory credits in some periods
- Energy Generation & Storage
- Storage deployments (Megapack / Powerwall)
- Solar (depending on the period)
- Services and Other
- Supercharging / connectivity
- Service centers
- Used car sales, insurance (where applicable), etc.
From a modeling perspective:
- Automotive is a unit-driven business (deliveries × ASP logic)
- Energy is a capacity-driven business (GWh deployed × revenue per GWh logic)
- Services is often a trend-based business unless you have granular volume and pricing
Why Tesla Is Harder Than Traditional OEMs
Traditional OEM modeling often relies on:
- region-wise volume
- model-wise pricing
- plant utilization and capacity details
- detailed cost disclosures
Tesla does not always disclose that cleanly.
So we do two things:
- Use what Tesla does disclose (especially in quarterly decks)
- Fill the missing operational picture using a market share + market size framework
This is a realistic approach used in many equity research models when disclosures are limited.
Template Walkthrough: What Sheets Exist and How They’re Used
In the template referenced in your transcript, you’ve structured it like a proper institutional model:
- Income Statement
- Balance Sheet
- Cash Flow
- Revenue Driver
- Market Share
- Cost Matrix (to be built deeper in Part 2)
At this stage (Part 1), Income Statement → Cash Flow contains historicals up to 2025, and the main work happens in:
✅ Revenue Driver Sheet
✅ Market Share Sheet
How To Forecast Tesla Automotive Revenue (The Proper Way)
Step 1: Break revenue into segment totals
Using Tesla’s disclosures (annual + quarterly), you build the historical split:
- Automotive revenue
- Energy revenue
- Services/Other revenue
This gives you two useful perspectives:
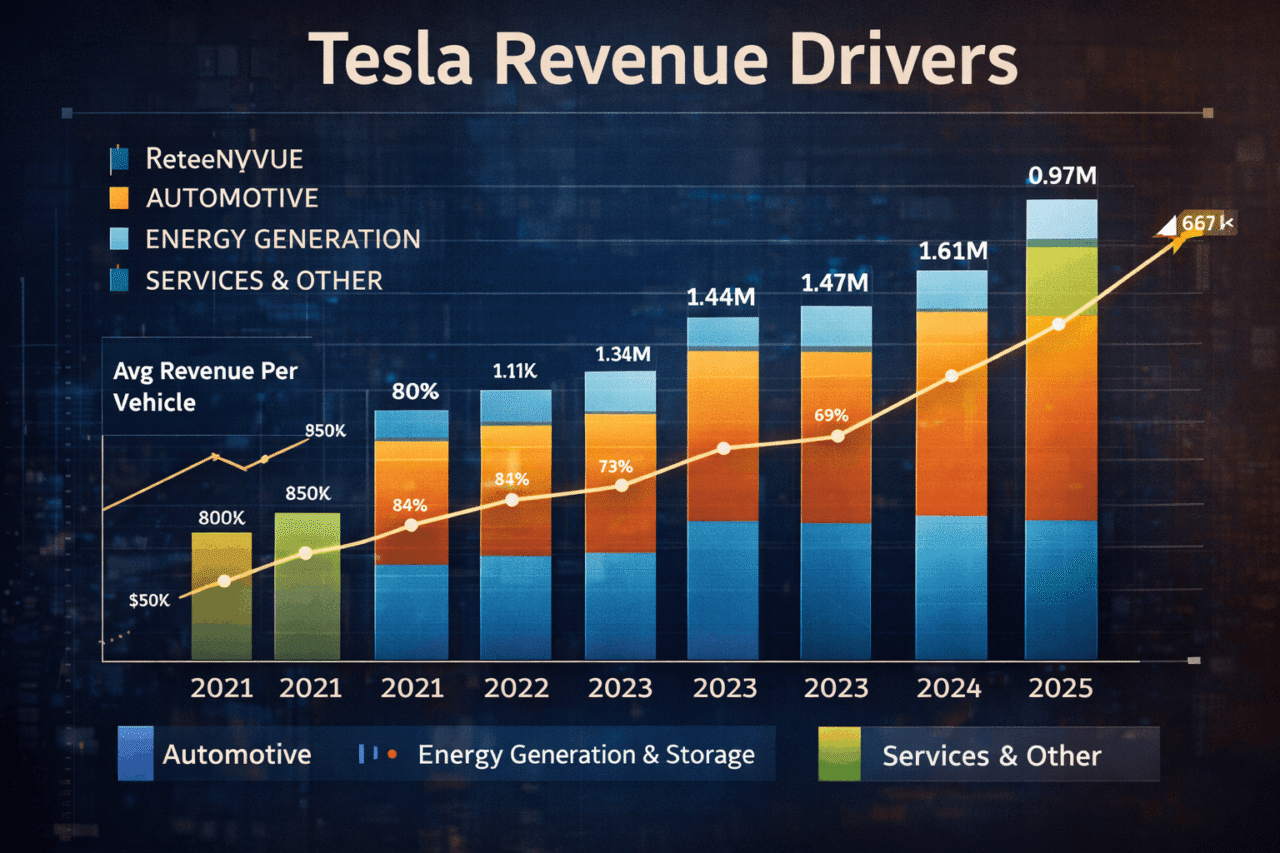
- Segment mix (what % each segment contributes)
- Segment growth trends
In your transcript, you noted that Automotive is the majority contributor historically, while Energy and Services can be meaningful—and potentially grow faster.
Step 2: Derive average revenue per vehicle (a proxy for ASP)
Since Tesla’s pricing varies across models and regions, a clean modeling shortcut is:
Average revenue per vehicle = Automotive Revenue ÷ Total Deliveries
This is not perfect (leasing, credits, mix shifts), but it’s a strong baseline when building a scalable forecast engine.
In the transcript, you observed:
- Tesla’s average revenue per unit has been declining
- Primary drivers:
- more competition (BYD, Chinese OEMs, legacy OEM EV launches)
- price wars and discounting
- mix shifts toward lower-priced models
This is exactly the kind of insight that should guide your assumptions:
- don’t blindly increase ASP
- don’t model “premium pricing forever”
- reflect competitive reality
Step 3: Capacity sanity check (most people forget this)
You highlighted something very important:
Tesla has global capacity well above current deliveries (example: capacity ~2.35m vs deliveries ~1.6m in your narration).
Implication for the model:
- you must be careful with capex forecasting
- you must avoid “infinite growth capex” when utilization is not yet maxed
- you must build growth in a way that respects capacity and demand
Even if capex comes in Part 2, this sanity check should already influence Part 1 volumes.
Energy Revenue: Storage Deployments + Unit Economics
Tesla Energy can be modeled more cleanly than many people think—if you use deployments.
From Tesla’s investor decks, you can often find:
- Storage deployed in GWh (or similar operational metrics)
Then you derive:
Revenue per GWh = Energy Revenue ÷ Storage Deployed (GWh)
In your transcript, you noted:
- revenue per GWh has also shown pressure (competition + scaling + pricing dynamics)
- but the deployment growth can be strong
- there’s a realistic long-term possibility that Energy becomes larger than Auto (depending on trajectory)
That’s a powerful thesis point—and it’s exactly why segment modeling matters.
Forecast approach used in your model
You used a practical method:
- forecast storage deployments to a target level by 2030 (example mentioned ~100 GWh in your narration)
- ramp linearly (or with a curve if you add deeper research later)
- hold revenue per GWh relatively conservative unless you have strong evidence otherwise
This is the right discipline: don’t inflate unit economics without evidence.
Services & Other: Trend-Based Forecasting (For Now)
Services is tricky because:
- Supercharging economics depend on pricing, utilization, geography, charging behavior
- Tesla does not always disclose the exact “units” like number of charging sessions, average fee, etc.
So your approach in the transcript is reasonable for Part 1:
- focus on the growth trend
- use conservative growth continuation rather than aggressive assumptions
- revisit later if better operational data becomes available
This keeps the model believable and avoids false precision.
This section is the real “equity analyst” move.
A student model often says:
“Tesla revenue grows at 20%.”
An analyst model says:
“EV market grows at X% by region, Tesla has Y% share, therefore Tesla deliveries = market size × share.”
That difference is what makes interviewers excited, because it shows you’re not forecasting Tesla in isolation—you’re embedding it inside the total addressable market.
Why bottom-up is hard here
You said it clearly: fully bottom-up (model-by-model, region-by-region) is difficult because disclosures are incomplete.
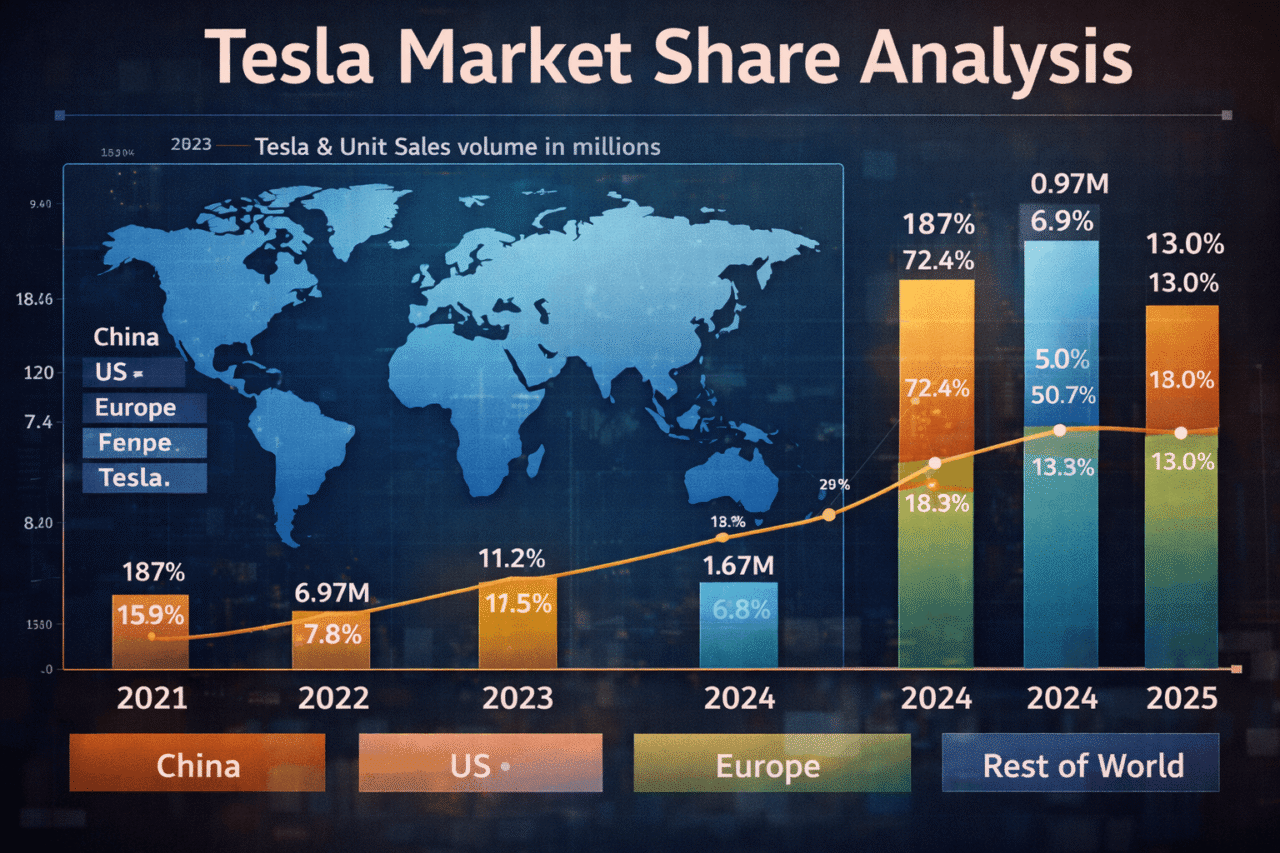
So you used a top-down market framework:
- Find EV sales by region (China / US / Europe / Rest of World)
- Compute Tesla’s unit share in each region historically
- Observe trend: Tesla share has declined as competition expands
- Forecast EV market growth using adoption assumptions
- Apply Tesla share assumption to projected market size → Tesla deliveries forecast
This is a solid approach.
EV Market Growth: Adoption Logic and Forecasting Total EV Sales
To forecast Tesla deliveries, you first forecast total EV sales.
In the transcript, you described:
- historical EV sales growth (2021 onward)
- increasing concentration of EV sales in China over time
- adoption targets / mandates varying by country
You then used a practical modeling bridge:
- assume a global EV market growth rate (you mentioned ~20% as a base consensus-type number)
- project total EV sales out to 2030
- allocate across regions using a region share structure (China, US, Europe, Rest of World)
This creates the “market size runway.”
Turning Market Into Tesla Deliveries: The Key Multiplication
Once you have:
- projected EV units by region
- Tesla market share assumption
You compute Tesla units.
In your narration, you used a simplifying “best-case” structure:
- hold Tesla market share constant (or at least not assume dramatic recovery)
- let the market growth drive most of the unit increase
Then you linked those projected deliveries back into the revenue driver sheet and computed:
Automotive Revenue = Deliveries × Average Revenue per Vehicle
This makes the model fully linked and mechanically consistent:
- market → share → deliveries → revenue → financial statements (in later parts)
Revenue Forecast Summary (What Your Part 1 Produces)
By the end of Part 1, you have:
✅ A revenue model that is:
- segment-based (Auto/Energy/Services)
- unit-driven where possible (deliveries, GWh)
- market-informed (EV market growth + Tesla share)
- conservative on pricing (no random ASP expansion)
✅ A framework that can be extended in Part 2:
- margins and costs by segment
- working capital assumptions
- capex tied to capacity utilization
- circular schedules (PPE, debt, depreciation)
In other words: Part 1 builds the engine. Parts 2 and 3 build the vehicle around it.
How To Use This Template (Recommended Workflow)
If you’re downloading the template from the YouTube description, here’s the fastest way to use it properly:
- Do not touch projections first
- review historical segment split
- confirm totals reconcile to filings
- Validate unit economics
- Automotive: revenue per vehicle trend
- Energy: revenue per GWh trend
- sanity check outliers
- Build market sheet
- input EV sales by region historically
- compute Tesla share
- decide base / bull / bear share assumptions
- Link deliveries back to revenue
- deliveries × revenue per vehicle
- storage deployment × revenue per GWh
- services growth trend
- Only then move to cost forecasting (Part 2)
What’s Coming Next (So You Know How This Becomes a Full DCF)
Part 2 will typically include:
- gross margin logic (auto vs energy vs services)
- operating expenses as % of sales with operating leverage
- depreciation setup (Tesla GAAP presentation requires careful handling)
- working capital roll-forwards
Part 3 will complete:
- fully linked balance sheet
- debt schedule / interest
- PPE schedule and capex logic
- DCF valuation + sensitivity tables
Final Note
The biggest takeaway from this Tesla modeling series is not “how to build a spreadsheet.”
It’s this:
A financial model is a business story written in numbers.
If you don’t understand the business model, the segment drivers, and the market structure, your Excel will always look impressive—but it will be wrong.
