Last updated on October 23rd, 2024 at 04:28 pm
The sampling error formula is Sampling Error = Z x (σ /√n), is a statistical formula and tool used to calculate the overall inaccuracy of the calculation. Of course, when I just discuss the formula then it appears complicated. However, as I will explain with real life examples then it will become easier to understand.
What Is Sampling Error?
Now, let me take a very simple example to understand what sampling error and sample error formula is.
- You are try to calculate average returns of stock market using the sample period between 2015- 2022. While the population is from 1992 to 2023. The difference in the sample mean and population mean is sampling error.
- Similarly, if you are trying to find the average house prices in Mumbai. And you took a sample from navi Mumbai. Then the difference between total population of Mumbai flats and your sampling mean is sampling error.
Step by Step Formula to Calculate Sampling Error in Excel
Nevertheless, the above examples do intuitively point at the ease of this concept. However, its easier said then done. So let me explain the sampling error formula calculation using spreadsheet.
First Step
So before I jump into the sampling error formula its easier to look at a scenario.
- So below you can see I have 20 observations of marks of students in a class
- And I have take the marked in yellow as sample for the class.
- While the population is the total 20 observations of marks of students.
- Accordinly I have calculated the three thingsl; namely mean, standard deviation and number of observations of the sample

Second Step:
Now just look that you can clearly see that there is difference in the population mean calculation and sample mean calculation. That is nothing but sampling error. However in the real world you won’t have the population. That is the reason why we have something called as Z Table.
Now before you get confused. Let me quickly explain what is this table. So the table below shows nothing but probabilities. For example at both the axis 0.0, the probability is 50% or 0.5. And as you start going towards a particular direction towards the right or left the probabilities start increasing.
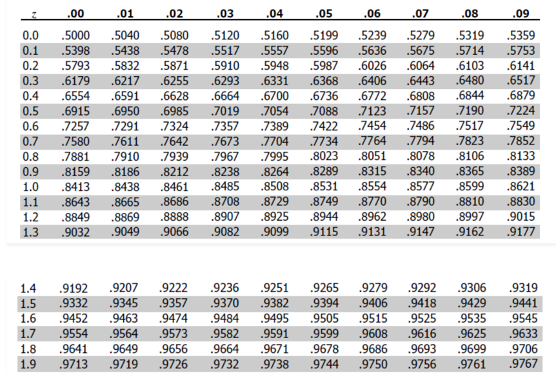
Third Step:
Now, that you understand what this z table does. How do we decide which z value to take. That depends on you. At how much probability do you want to calculate the sampling error. Hence in the sampling error formula which is Z x (σ /√n), the Z is nothing but the left most vertical values and intersection of the horizontal top most coloumn. Hence at 97.5% probability the Z value is 1.96.
So the samling error would be: 1.96 x Population SD/ Sq root of sample size= 10. Which is obviously high but that’s understandable since our sample size is only 6.
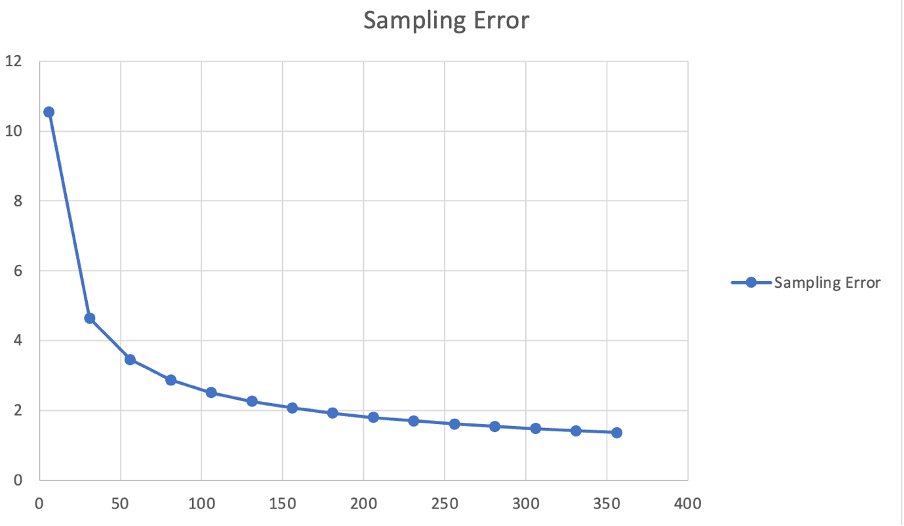
Sampling Error With Different Sample Size.
An interesting thing that will probably be intuitive to understand the sampling error formula itself. The formula says sampling error = Z x SD/ n. Which means as the sampling error is inversely proportional to the sample size. I made a chart below for you to visualize this.
Types of Sampling Error
Now this error in sampling can occour in various circumstances. Let me briefly take you through such scenarios.
- Firstly Population specific error, when you take the wrong sample because you don’t understand the context. For example; I am researching on jewlwery purchase decisions but I incorrectly survey males. Leading to wrong conclusions.
- Secondly, non response error when the the survey returns non responses.
- Thirdly the error in samples can also occour because you took the wrong period for calculations. For instance in calculating the average returns of the stock market you took the period as 2015 to 2020 (A boom period)
Real Life Sampling Error Cases
Now, that you understand the basics of how and when. Let me take some real life examples which probably you can relate
- Youtube survey: A very easy place to make sampling error mistake can happen, if you want to conduct a survey of viewers. However since most of the time you don’t already know the background of the surveyer. You might get response from people who only have more time, which is kids. While incorrectly concluding your survey.
- The Franklin D Roosevelet election where the opinion polls failed with a sample error of almost. Where it predicted that Landon would win 57% of the votes.
Uses of Sample Error and Its importance
Let me put it straight and easy. When you are trying to predict or rather generalize some findings. And when you are doing the same for a large data set, there are obviously going to be errors. Never can any system be 100% accurate. Hence the sampling error formula lets you know in advance the correction that might be needed or to be expected .
How to Minimise Sampling error?
While no matter what you try, sampling error is impossible to completely eliminate but it is definitely possible to reduce. Here are some tips to reduce sampling error.
- First and foremost study the context and then select the population.
- Secondly increase the sample size as much as possible. As you already know that higher sample means lower error.
- Thirdly take random sampling instead of pre-planned samples to reducing the erro.
Sampling Error Versus Standard Error
While sampling error tells you a percentage amount of error. The standard error helps you calculate a range of possible outcomes.
FAQ’s
Is it possible that sampling error is negative?
Ofcourse, the sampling error is just telling how different is the population from what you calculated. And that can be on the lower side or upper side.
Can sampling error be completely eliminated?
Not really possible but it definitely can be reduced by using the best practices of increasing sample size, studying the population and context.
Is the formula for sampling error and standard error the same?
Sampling error formula and standard error formula is different. In sample error formula you are trying to calculate the difference between population and sample. While in sampling you are tryint to calculate the a range of possible outcomes.

