Last updated on October 23rd, 2024 at 04:55 pm
Contribution analysis is a method used to determine the profitability of different products, services, or business units within a company. The goal of contribution analysis is to identify which products or services are generating the most profit and which are not, in order to make informed decisions about where to allocate resources and focus efforts. In this article we will discuss, the contribution analysis formula and contribution analysis example.
What is Contribution Analysis?
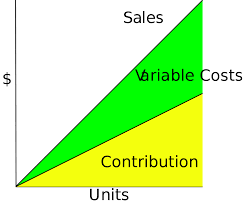
Contribution analysis is used in estimating how direct and variable costs of a product affect the net income of a company. So, it addresses the issue of identifying simple or overhead costs related to several production projects. Contribution analysis aids a company evaluate individual business lines or products and their performance by comparing their contribution margin dollars and percentage. Direct and variable costs incurred during the manufacturing process are subtracted from revenue to arrive at the contribution margin. This is a very crucial tool for managing the growth of any business.
How is it done?
To conduct the analysis, a company will typically calculate the contribution margin, which is the difference between the revenue and variable costs of a product or service. The contribution margin can be used to determine the profitability of each product or service, as well as the overall profitability of the business.
There are different ways to perform the analysis, but one common method is to use a contribution margin ratio. It calculates the ratio of contribution margin to sales for each product or service, which can then be used to compare the profitability of different products or services and identify areas where improvements can be made.
In summary, Contribution analysis is a method used to evaluate the profitability of different products, services, or business units within a company by calculating the difference between the revenue and variable costs of a product or service, and using this information to make informed decisions about where to allocate resources and focus efforts.
Contribution Analysis Formula and Example
The formula for Contribution Margin dollars per unit is:
Contribution Margin = (Total revenue – variable costs) / No. of units sold
For example,
A company sells 10,000 shoes for total revenue of $500,000, with a cost of goods sold of $250,000 and a shipping and labor expense of $200,000.
The contribution margin per shoe is ($500,000 – $250,000 – $200,000) / 10,000
Contribution = $5.00 per shoe
Pros and Cons
Pros:
Contribution analysis helps in comparing how individual products are profitable to the company and is easy to use. The significance of its that it indicates the profitability of each product and helps you understand the various components and specific external and internal factors that influence a company’s income, and it utilizes existing information.
Cons:
- The sales price remain constant as no discounts are given.
- The product cost is linear
- There is no inventory as what s produced is sold immediately.
Contribution Analysis Case Study
A retail company, XYZ, sells a variety of products including clothing, electronics, and home goods. The company wants to conduct a contribution analysis to determine which products are the most profitable and where to focus their efforts.
To begin the contribution analysis, the company first gathered data on the revenue and variable costs for each product category. The variable costs include the cost of goods sold, such as the cost of the products themselves, as well as other variable costs such as shipping and handling.
The company found that the clothing category had the highest revenue at $1,000,000 but also had the highest variable costs at $700,000. The electronics category had a revenue of $800,000 and variable costs of $500,000. Finally, the home goods category had a revenue of $600,000 and variable costs of $400,000.
The company calculated the contribution margin for each category by subtracting the variable costs from the revenue. The contribution margin for clothing was $300,000, for electronics it was $300,000, and for home goods it was $200,000.
The company also calculated the contribution margin ratio for each category by dividing the contribution margin by the revenue. The contribution margin ratio for clothing was 30%, for electronics was 37.5% and for home goods was 33.3%.
The analysis revealed that the electronics category had the highest contribution margin ratio, indicating that it was the most profitable product category for the company. The company decided to focus on expanding its electronics product line and investing in marketing efforts to increase sales in this category.
It also found that the home goods category had a lower contribution margin ratio and the company decided to re-evaluate the pricing strategy for this category, as well as look for ways to reduce variable costs.
In summary, this case study demonstrates how a retail company used contribution analysis to evaluate the profitability of different product categories and make informed decisions about where to focus their efforts. By calculating the contribution margin and contribution margin ratio for each category, the company was able to identify the most profitable product category and make strategic decisions to improve overall profitability.

