Last updated on November 22nd, 2024 at 03:10 pm
According to a 2023 survey conducted more than 80% of the job postings in data analysis, financial modeling, project management require high proficiency in Microsoft excel. However, excel is so wide and so is its application that having a clearly defined advanced excel course syllabus is important. In this article, I will bring my own as well as experience from Industry expert. Who will share their own recommendations on the the right level of knowledge.
The use of excel ranges from data visualisation to formulas and even automation via VBA. These three major areas of application is used by more than 95% of the analysts in finance.
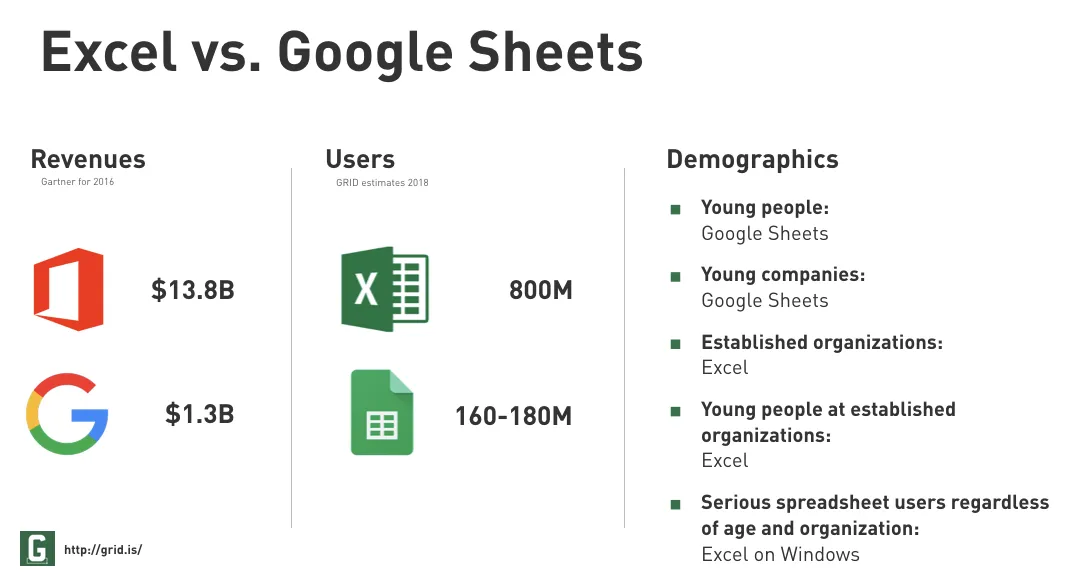
Is Microsoft Excel Still Relevant?
Before digging deeper into the syllabus, let me first set the stage on the first most important questions. How relevant and important is microsoft excel today, in an era of google sheet, Spreadsheet by Apple etc. So putting the question to test, below is one of the statistic I came across. Microsoft excel still dominates with close to a billion users. Infact in my own personal experience,I use microsoft excel for the most important models and serious work. Google sheet I usually use more like a data sharing tool, in case I want another user to check the file parallel.
Course Overview: What to Expect in an Advanced Excel Course Content
Excel Tools used in Various Roles
Now let me summarise and map the various areas of excel to the various activities in data analysis, finance and business. This should give you a fair idea on which area to focus on excel.
Excel Functionalities Mapped to Roles
| Excel Functionality | Data Analysis Role | Finance Analysis Role | Business Management Role |
|---|---|---|---|
| PivotTables | Summarizes and analyzes large datasets to extract insights. | Used to summarize financial data like expenses and sales. | Track KPIs and operational data across business units. |
| Power Query | Extract, transform, and load data from multiple sources for analysis. | Consolidate data from financial reports for better analysis. | Pull data from different departments to create unified business reports. |
| Data Sorting and Filtering | Sort and filter large data sets to find trends and patterns. | Used to filter out unnecessary financial data for reports. | Filter sales, inventory, and operational data for better insights. |
| Conditional Formatting | Highlights key trends and outliers in data analysis. | Used to highlight critical financial KPIs like cash flow or revenue. | Visualize performance metrics for business dashboards. |
| Financial Modeling (NPV, IRR, PMT) | Not frequently used. | Project financial forecasts and evaluate investment opportunities. | Financial forecasting for strategic business planning. |
| Scenario & What-If Analysis | Helps test different data scenarios for better decision-making. | Evaluate financial outcomes based on different business assumptions. | Helps in strategic decision-making by testing multiple business scenarios. |
| Goal Seek & Solver | Optimize data models to find target results based on constraints. | Used for budgeting and finding optimal financial strategies. | Helps automate and optimize business processes and targets. |
| Dashboards | Create data dashboards for visualizing trends and KPIs. | Build financial dashboards to visualize profit, loss, and cash flow. | Track high-level KPIs and operational performance across the business. |
| Macros | Automate repetitive data analysis tasks and processes. | Automates recurring financial tasks like monthly reporting. | Streamline business processes by automating repetitive tasks. |
Core Modules in the Advanced Excel Content
Advanced Excel Course Syllabus for Finance and Business
This advanced Excel course is designed for finance and business professionals looking to enhance their data analysis, reporting, and automation skills. The course includes practical case studies and learning outcomes for each module to ensure job-ready skills.
Module 1: Advanced Formulas and Functions
Topics Covered:
- Logical Functions: IF, AND, OR, IFERROR, Nested IF
- Lookup Functions: VLOOKUP, HLOOKUP, INDEX, MATCH
- Math Functions: SUMIFS, COUNTIFS, AVERAGEIFS, SUMPRODUCT
- Financial Functions: NPV, IRR, PMT, XIRR, XNPV
- Text Functions: CONCATENATE, TEXT, LEFT, RIGHT, MID
- Date and Time Functions: DATE, EOMONTH, TODAY, NETWORKDAYS
Learning Outcomes:
- Master advanced Excel formulas for financial modeling and analysis.
- Understand how to build complex logic using nested IF and lookup functions.
- Analyze large datasets using conditional and logical operations efficiently.
Case Study: Automating Financial Reports with Advanced Formulas
Participants will work on a case study where they automate a quarterly financial report using advanced Excel formulas such as SUMIFS, IFERROR, and VLOOKUP. They will create dynamic reports that update automatically as data changes.
Module 2: Financial Modeling and Analysis
Topics Covered:
- Building Financial Models: Cash Flow, Profit & Loss, Balance Sheets
- Scenario and What-If Analysis: Data Tables, Scenario Manager, Goal Seek
- Forecasting Techniques: Trend Analysis, Regression Models, Projections
- Sensitivity and Break-even Analysis: Advanced financial modeling for risk management
Learning Outcomes:
- Create comprehensive financial models including cash flow and P&L statements.
- Use scenario and what-if analysis to evaluate financial performance under various conditions.
- Develop forecasting models for financial planning and decision-making.
Case Study: Developing a Financial Model for Investment Analysis
Participants will build a complete financial model for evaluating a new investment. They will apply scenario analysis to assess the impact of market changes on projected revenue and costs, using advanced Excel tools such as Goal Seek and Solver.
Module 3: Data Visualization and Reporting
Topics Covered:
- Creating Advanced Charts: Line, Bar, Pie, Combo Charts
- PivotTables and PivotCharts: Data summarization and interactive dashboards
- Conditional Formatting: Data Bars, Color Scales, Icon Sets
- Building Dynamic Dashboards: Using Form Controls, Slicers, and PivotTables
Learning Outcomes:
- Design dynamic and visually appealing dashboards for financial and business reporting.
- Use PivotTables and advanced charts to summarize and present data effectively.
- Master the use of conditional formatting to highlight key data trends and outliers.
Case Study: Building a Dynamic Business Dashboard
Participants will create a real-time business performance dashboard using Excel PivotTables, Slicers, and Charts. The dashboard will dynamically update as new data is added and will be used to present KPIs to management.
Module 4: Automation and Macros in Excel
Topics Covered:
- Introduction to Macros: Recording, editing, and running Macros
- VBA Basics: Understanding and writing VBA code for automation
- Automating Reports: Creating repeatable processes for financial reporting
- Error Handling in VBA: Debugging and managing errors effectively
Learning Outcomes:
- Learn to automate repetitive Excel tasks with Macros and VBA.
- Create efficient workflows for automating business and financial reports.
- Develop interactive Excel tools using forms and VBA for user inputs.
Case Study: Automating Financial Forecasts with VBA
Participants will automate a financial forecasting process using Excel VBA
•
Practical Excel Skills for Business Applications
It’s important to get an understanding of how these various excel functions play out in real life scenario. And how knowing them makes your employability chances higher and productive.
Project Management Real Life Excel Applications

Usually project management involves managing the end top end execution of a project. Which basically means the use of excel for making sure that all the acitivities are on time and as per the schedule
Use Case:
In a software development project, the project manager needs to monitor potential risks, such as missed deadlines or lack of resources, and track mitigation strategies.
Excel Application:
A Risk Management Tracker is created in advance Excel to document each identified risk, its probability, potential impact, and assigned mitigation strategies. The project manager uses conditional formatting to flag high-priority risks in red, medium in yellow, and low in green. Drop-down lists allow the team to update the status of each risk (e.g., “Open,” “Mitigated,” or “Resolved”).

Subtle Use of Excel in IT Project Management
Excel plays a subtle but critical role in project management by allowing managers to create and maintain various lists and databases. These can range from a simple team contact list to an elaborate project database, providing essential capabilities such as data analysis, the creation of graphs, and the use of Pivot Tables for in-depth project data reporting.
Maxim Petrov, Project Management consultant at Collective Tools
Financial Analyst Advance Excel Use Cases
The role financial analyst is a wide term which can mean a Equity research analyst, Budgeting and forecasting analyst, Investment banking analyst etc. Let me cover some basic use cases of excel in finance.
Use Case
An Equity analyst has created an entire equity DCF Valuation model on excel but wants to test the sensitivity to the core assumptions to test the validity of the model in real life.
Excel Application
There are mutiple functions used for sensitivity analysis like data table, scenario manager or Goal seek functions. This function helps in changing the core values temporarily and test the outcome.
Advanced Excel Course Formulas and Functions in Excel Examples
When anyone says advanced, it should mean more deep use of the functionality. So let me discuss some of the examples of Advanced excel formulas in Detail. So below you can see a table for various Products from A to D, with specific quantity being sold and at different prices.
Sum Product
Formula=SUMPRODUCT(B2:B5, C2:C5)
So below you can see a table for various Products from A to D, with specific quantity being sold and at different prices. And now you want to get the total revenue. Then you can use this sumproduct formula.
SUMPRODUCT Function Example
| Product | Quantity Sold | Price per Unit ($) |
|---|---|---|
| Product A | 10 | 15 |
| Product B | 5 | 20 |
| Product C | 8 | 12 |
| Product D | 6 | 25 |
Total Revenue: $496
Index Match
Now moving on to some other type of advance excel formula which is primarily used to find a certain value in a data based.
INDEX MATCH Function Example
| Product | Price per Unit ($) |
|---|---|
| Product A | 15 |
| Product B | 20 |
| Product C | 12 |
| Product D | 25 |
Price of Product C: $12
Let us suppose that you want to find the price of product C, in that case this is how the function will be used.
Conclusion
Learning advance excel is very crucial and so is the importance of a relevent advance excel course syllabus which fullfills the requirements.
FAQ’s
Major topics that I would categorise under advance excel are as follows:
Dashboard creation, What if Analysis, Advance Charts, VBA Macros, Goal Seek, Nested Functions etc.
The topic of advance excel includes the skill to create advance dynamic dashboards, which have sliders in them. Also for instance includes the skill to deal with large data sets and ability to analyse it.
Yes and No and it depends on your goals and time commitment. If you are able to dedicate ample time in learning the skill then yes advance excel is easy.
Typically if you already have a background in basic excel, then 2-3 months of self practice apart from the classes is necessary.
In my opinion VBA and Macros in excel is the most difficult thing to learn in excel
