
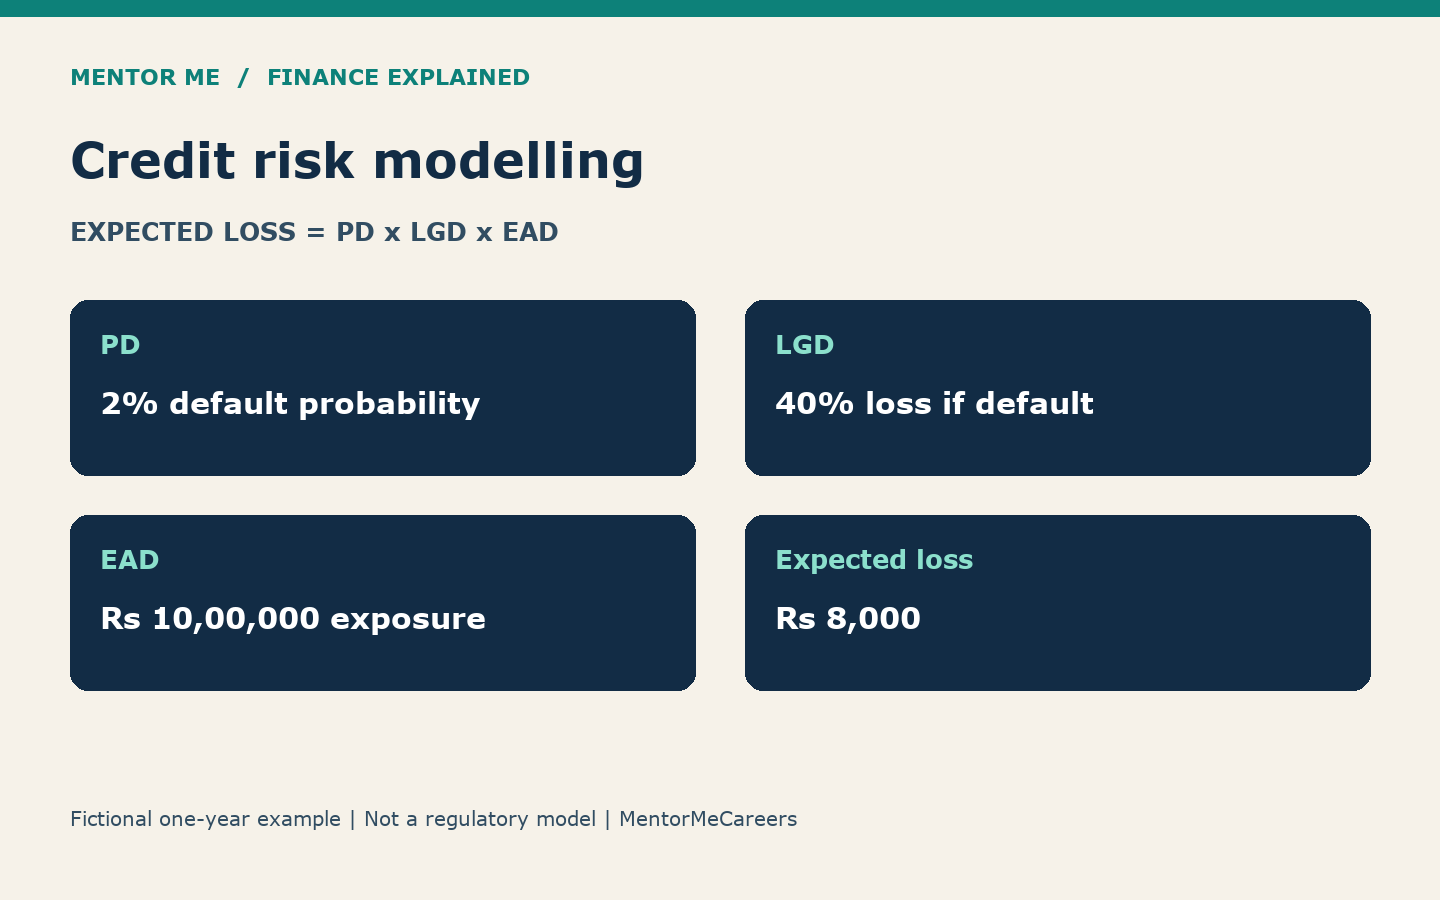
Credit risk modelling estimates the chance that a borrower will default and the loss a lender may face. Three core inputs are probability of default (PD), loss given default (LGD) and exposure at default (EAD). A simple expected-loss calculation multiplies all three. A useful model also checks the data, assumptions and limits behind them.
By Allen Aravindan, CFA
Start with a ₹10 lakh loan. A 2% chance of default does not mean the lender expects to lose the whole ₹10 lakh. The loss also depends on the amount outstanding at default and what the lender can recover. This guide builds that logic step by step.
What does credit risk modelling measure?
Credit risk is the risk that a borrower or counterparty fails to meet an obligation. A model turns relevant evidence into a risk estimate for a stated purpose and time period. A lending decision, portfolio review, stress test and accounting estimate may need different models.
Do not treat a model output as a fact about a person. It is an estimate based on selected data and assumptions. It may become less reliable when lending standards, customer behaviour or the economy change. Human review and controls still matter in credit risk modelling.
The CFA Institute credit-analysis overview explains broader model approaches. Here, we will start with the loss building blocks before moving to data and validation.
PD, LGD and EAD in plain English
| Input | Meaning | Unit | Question to ask |
|---|---|---|---|
| PD: probability of default | Estimated chance of a defined default within a stated horizon | Percentage | What counts as default, and over what period? |
| LGD: loss given default | Share of exposure lost if default occurs, after relevant recoveries and costs | Percentage | What net recovery can the lender expect? |
| EAD: exposure at default | Amount exposed when default occurs | Currency | What will still be owed, including relevant future drawdowns? |
| Expected loss | Probability-weighted loss for the stated assumptions | Currency | Are the inputs defined on a compatible basis? |
For a basic one-period teaching model: Expected loss = PD × LGD × EAD. Enter 2% as 0.02, not 2. Keep both percentages in decimal form before multiplying.
This equation is a useful foundation for credit risk modelling. It is not, by itself, a complete IFRS 9 impairment calculation or a regulatory capital model. The accounting and regulatory frameworks add requirements that a three-cell example does not capture.
Worked credit risk modelling example
Assume a fictional loan has a one-year PD of 2%, an EAD of ₹10,00,000 and an LGD of 40%. The LGD already reflects the recovery assumptions in this simplified example. Ignore discounting and other adjustments for now.
| Input or result | Value | Meaning |
|---|---|---|
| PD | 2% | Estimated default chance over one year |
| EAD | ₹10,00,000 | Exposure if default occurs under the scenario |
| LGD | 40% | Loss share conditional on default |
| Loss if default occurs | ₹4,00,000 | 40% × ₹10,00,000 |
| Expected loss | ₹8,000 | 2% × 40% × ₹10,00,000 |
The ₹4 lakh and ₹8,000 answer different questions. ₹4 lakh is the assumed loss if default happens. ₹8,000 is the probability-weighted expected loss. It is not the amount the lender will necessarily lose on this one loan.
Across many comparable exposures, expected loss describes an average under the model assumptions. A single exposure can perform fully, default with a different recovery or follow another outcome. Do not describe the expected value as a guaranteed bill.
Build the calculation in Excel
| Cell | Label | Value or formula |
|---|---|---|
| B2 | PD | 2% |
| B3 | LGD | 40% |
| B4 | EAD | 1000000 |
| B5 | Loss conditional on default | =B3*B4 |
| B6 | Expected loss | =B2*B3*B4 |
Use percentage formatting for B2 and B3 and currency formatting for B4 to B6. Keep the formula cells separate from inputs. Add a note with the horizon, default definition, source date and model purpose. Those details matter as much as the arithmetic.
Run three boundary checks. If PD is 0%, expected loss is zero under this model. A zero LGD also gives zero expected loss. With PD and LGD both at 100%, expected loss equals EAD. A failed check can reveal a percentage or cell-reference error.
Credit risk modelling stress tests
Now raise PD to 5% and LGD to 55%. Keep EAD at ₹10 lakh. Expected loss becomes ₹27,500. If EAD also rises to ₹12 lakh, expected loss becomes ₹33,000. These are scenarios, not forecasts.
| Scenario | PD | LGD | EAD | Expected loss |
|---|---|---|---|---|
| Base | 2% | 40% | ₹10,00,000 | ₹8,000 |
| Higher default and loss severity | 5% | 55% | ₹10,00,000 | ₹27,500 |
| Same stress plus higher exposure | 5% | 55% | ₹12,00,000 | ₹33,000 |
Changing PD alone would miss the combined effect of poorer recoveries and higher exposure. In a downturn, several inputs may worsen together. That is why a useful stress test needs a coherent scenario rather than unrelated percentage increases.
Credit risk modelling: estimate probability of default
Begin with a clear default label and observation window. Suppose 20 of 1,000 comparable loans default during a defined one-year follow-up. The raw observed rate is 2%. That is a historical rate for that cohort, not automatically the right PD for every new loan.
Check whether all 1,000 loans had the full follow-up period. Also check missing outcomes, changes in underwriting and differences between borrower groups. A dataset with short follow-up can understate defaults. A dataset drawn only from accepted applications may not represent every applicant.
A scorecard or logistic regression can relate recorded features to an estimated default probability. More complex models may capture other patterns. Complexity does not remove bias or guarantee better performance on new data. Use only appropriate, lawfully obtained data and test the model for the lending context.
How do you estimate loss given default?
Start with the expected loss after recoveries, relevant collection costs and the chosen timing basis. Do not assume the collateral’s headline value equals the amount recovered. Sale costs, senior claims, delays and changes in asset value can reduce recovery.
For a simple undiscounted case, assume exposure of ₹10 lakh and net recovery of ₹6 lakh. Loss is ₹4 lakh, so LGD is 40%. If you already used net recovery, do not subtract the same costs again. That would count them twice.
Credit risk modelling also needs sound recovery assumptions. Real LGD models may need recovery timelines, discounting, product segments and economic conditions. Read the relevant policy. A single historical average may hide major differences between secured and unsecured loans.
How do you estimate exposure at default?
For an amortising loan, EAD relates to the amount exposed when default occurs, with any relevant accrued amounts and terms. In credit risk modelling, it is not always the original loan principal. Repayments can reduce it before default.
For a credit line, the borrower may draw more before default. Suppose ₹6 lakh is drawn on a ₹10 lakh limit. A purely illustrative 50% drawdown assumption on the ₹4 lakh undrawn portion gives EAD of ₹8 lakh: ₹6 lakh + 50% × ₹4 lakh. This is a teaching assumption, not a prescribed regulatory factor.
The Federal Reserve’s published stress-test methodology gives an example of modelling exposure on revolving credit. Use it to understand the concept, not as an Indian lending rule.
Credit risk modelling: validate before trusting the output
- Time split: train on earlier data and test on a later period. A random split alone can hide changes over time.
- Leakage check: remove information that would not have been available when the decision was made.
- Ranking ability: test whether higher predicted risk corresponds to higher observed default rates.
- Calibration: compare predicted probabilities with observed rates. Good ranking does not ensure accurate probabilities.
- Segment review: inspect product and borrower groups rather than relying only on one portfolio average.
- Stability: track changes in input data and performance after deployment.
- Governance: record versions, approvals, overrides, limits and a clear review owner.
For example, a model can rank borrowers well but predict 1% default for a group that later records 4%. Its ordering may be useful, yet its probability estimates are too low. Review calibration before feeding those numbers into a loss estimate.
Expected loss, IFRS 9 ECL and capital are different
Expected loss is an average loss concept. Accounting expected credit loss, or ECL, applies the relevant reporting rules. Under IFRS 9, that involves forward-looking information, probability weighting, discounting and the applicable 12-month or lifetime horizon. Twelve-month ECL is not simply cash shortfalls expected to occur during the next twelve months.
Regulatory capital addresses a different prudential purpose. Do not set required capital equal to the ₹8,000 teaching result. Nor should you label that number a compliant provision without checking the full framework. The IFRS 9 overview is a starting point for the accounting context.
Skills to practise for a credit-risk role
Build a clean data table, calculate loss scenarios and explain your assumptions in plain language. Excel helps with the first model. SQL can help extract and check larger data. Statistical work may use Python or R. The tool matters less than a sound definition, reliable data and a model you can explain.
Read our guide to risk-management roles for career context. Before analysing a borrower, review financial instruments and the tools of financial statement analysis.
Common questions about credit risk modelling
What are the three main components of credit risk modelling?
PD, LGD and EAD are three core components of a basic expected-loss model. PD measures default chance, LGD measures loss severity if default occurs, and EAD measures the amount exposed. A full model also needs a defined purpose, horizon and validation process.
What is the difference between a credit score and PD?
A score ranks or summarises risk on a chosen scale. PD is a probability for a defined default event and horizon. A score may be mapped to PD, but the mapping needs evidence and review. A score of 700 is not a 7% default probability.
Is credit risk modelling the same as financial modelling?
No. Financial modelling is a broader set of methods for representing financial performance and decisions. Credit risk modelling focuses on default, exposure and loss. Accounting, cash-flow analysis and data skills support both, but each role needs its own technical knowledge.
Does machine learning remove bias from lending models?
No. Biased data, incomplete outcomes and proxy variables can affect a statistical or machine-learning model. Test the data and model, document limits and follow the applicable legal and governance requirements. Automation does not make a decision fair by default.
Can a beginner start with Excel?
Yes. Start with a transparent PD × LGD × EAD model and scenario table. Then learn data preparation, basic statistics and validation. A spreadsheet example teaches the mechanics; it does not qualify the model for live lending decisions.
What is PD, LGD and EAD?
PD is the probability of a defined default over a stated period. LGD is the share lost if default occurs. EAD is the amount exposed at that point. Multiplying compatible inputs gives the simple expected-loss result used in this guide.
What is the ECL formula?
PD × LGD × EAD is a common building block for estimating loss, but a full expected-credit-loss calculation may require multiple periods, scenarios and discounting. Do not treat this one-year teaching formula as a complete IFRS 9 provision calculation.
Explain the result, then explain its limits
My preferred answer to the case is: “The one-year expected loss is ₹8,000 under a 2% PD, 40% LGD and ₹10 lakh EAD. The loss conditional on default is ₹4 lakh. I would validate the inputs and scenario basis before using either figure in a decision.”
To strengthen the accounting, Excel and forecasting foundations behind this work, explore our Financial Modelling course. Check the published syllabus for its scope; this article does not imply that it is a specialist credit-risk qualification.
Sources and further reading
Primary references: CFA Institute, Credit Analysis Models; World Bank, Analyzing Banking Risk; Federal Reserve, supervisory model descriptions; and IFRS Foundation, IFRS 9. All loan amounts, scenarios and examples above are fictional.

A CFA charterholder with hands-on experience across investment analysis and finance education. At MentorMeCareers, he writes and reviews content on CFA, financial modeling, and investment banking careers — grounded in real market data rather than generic advice, and shaped by what actually helps candidates and professionals succeed.