

The main tools of financial statement analysis are comparative statements, common-size statements, trend analysis, ratio analysis and cash flow analysis. Use them together to explain what changed, why it changed and what it means for a business. A ratio gives you a clue. Your job is to test that clue against the accounts.
By Allen Aravindan, CFA
A company can report higher sales and still face a cash squeeze. It can show a better current ratio while customers take longer to pay. I would not call either business stronger until I had checked the reason. This guide shows you how to make that judgement with one linked case.
Which tools of financial statement analysis should you use?
| Tool | Question it answers | First calculation |
|---|---|---|
| Comparative or horizontal analysis | What changed from one period to the next? | Current amount − prior amount |
| Common-size or vertical analysis | How large is each item relative to a common base? | Item ÷ revenue, or item ÷ total assets |
| Trend analysis | Is the change part of a longer pattern? | Current value ÷ base-year value × 100 |
| Ratio analysis | How do profits, assets, debt and liquidity relate? | Choose a formula that fits the question |
| Cash flow analysis | Did earnings turn into cash? | Compare operating cash with profit and working-capital movements |
Use the tools of financial statement analysis after you define the question. For a lender, cash available to service debt may matter most. For an equity analyst, margins, reinvestment and returns may need more attention. First understand the purpose and types of financial statements. Then decide what to measure.
Worked case: sales rise, but cash weakens
All amounts below are fictional and in ₹ lakh. The periods have the same length and accounting policies. The exercise gives selected data, not a full set of accounts. It assumes no acquisition, currency change or change in business mix.
| Selected item | Year 1 | Year 2 |
|---|---|---|
| Revenue | 100 | 120 |
| Cost of goods sold | 60 | 78 |
| Gross profit | 40 | 42 |
| Operating expenses | 25 | 30 |
| EBIT: earnings before interest and tax | 15 | 12 |
| Net profit | 9 | 7 |
| Trade receivables at year-end | 15 | 24 |
| Inventory at year-end | 10 | 16 |
| Total current assets at year-end | 40 | 48 |
| Current liabilities at year-end | 20 | 24 |
| Operating cash flow | 11 | 3 |
Revenue rose by 20%. That is the good news. Yet EBIT fell by 20%, and operating cash flow fell from ₹11 lakh to ₹3 lakh. A useful review must explain all three movements. Do not select the strongest number and ignore the rest.
1. Tools of financial statement analysis: comparative statements
Horizontal analysis places two periods side by side. Calculate both the rupee change and the percentage change. The amount shows scale. The percentage shows pace.
Percentage change = (current value − prior value) ÷ prior value × 100.
| Item | Change in ₹ lakh | Percentage change |
|---|---|---|
| Revenue | 120 − 100 = 20 | 20 ÷ 100 = 20% |
| Cost of goods sold | 78 − 60 = 18 | 18 ÷ 60 = 30% |
| Gross profit | 42 − 40 = 2 | 2 ÷ 40 = 5% |
| EBIT | 12 − 15 = −3 | −3 ÷ 15 = −20% |
Costs grew faster than sales. That explains why a 20% rise in revenue produced only 5% growth in gross profit. Next, ask whether input prices rose, discounts grew or the company sold a different mix of goods. The accounts alone do not prove which cause applies.
If the prior-year amount is zero, a normal growth percentage is undefined. If it is negative, the percentage can confuse readers. Show the amounts and explain the change in words instead of forcing a neat growth rate.
2. Common-size statements: compare the economics
Divide each income-statement item by revenue. For a common-size balance sheet, use total assets as the base. Keep that base consistent across the comparison. These financial analysis tools help you compare the economics, not just the size of each business.
| Measure | Year 1 | Year 2 | Interpretation |
|---|---|---|---|
| Gross margin | 40 ÷ 100 = 40% | 42 ÷ 120 = 35% | Down 5 percentage points |
| Operating-expense ratio | 25 ÷ 100 = 25% | 30 ÷ 120 = 25% | Unchanged as a share of revenue |
| EBIT margin | 15 ÷ 100 = 15% | 12 ÷ 120 = 10% | Down 5 percentage points |
The key pressure sits in gross margin. Operating expenses rose, but their share of sales stayed flat. This is a sharper conclusion than saying that all costs increased. Also, a fall from 40% to 35% is five percentage points, or a 12.5% relative decline. Those measures are different.
3. Trend analysis: widen the time frame
Two years can hide a one-off event. Suppose revenue was ₹80 lakh in Year 0, ₹100 lakh in Year 1 and ₹120 lakh in Year 2. Set Year 0 to an index of 100. The revenue indices become 100, 125 and 150.
This shows a 50% rise over the full period. It does not mean annual growth was 50%. Annual growth was 25% in Year 1 and 20% in Year 2. Use these financial analysis techniques to track margins, cash and debt beside the revenue trend to see whether growth creates value or strains resources.
4. Ratio analysis: ask what sits inside the ratio
The current ratio is 40 ÷ 20 = 2.0 in Year 1 and 48 ÷ 24 = 2.0 in Year 2. At first glance, liquidity looks stable. Financial analysis tools must also test what sits inside the ratio. Here, the receivables and inventory balances grew sharply. More of the current assets may now sit in items that take time to turn into cash.
Trade receivables rose 60%, while revenue rose 20%. Inventory rose 60%, while cost of goods sold rose 30%. These gaps justify a closer look at overdue invoices, stock ageing and payment terms. They do not, by themselves, prove poor collections or obsolete stock.
For a rough year-end receivables-days proxy, use receivables ÷ annual credit sales × 365. If all sales in this case were on credit, the proxy rises from 54.8 days to 73.0 days. State that assumption. For a fuller turnover analysis, use average balances and check seasonal peaks.
For more calculations, work through these ratio analysis questions and solutions. Avoid a universal “good” ratio. The business model, sector, season and debt terms affect the answer.
5. Cash flow tools of financial statement analysis
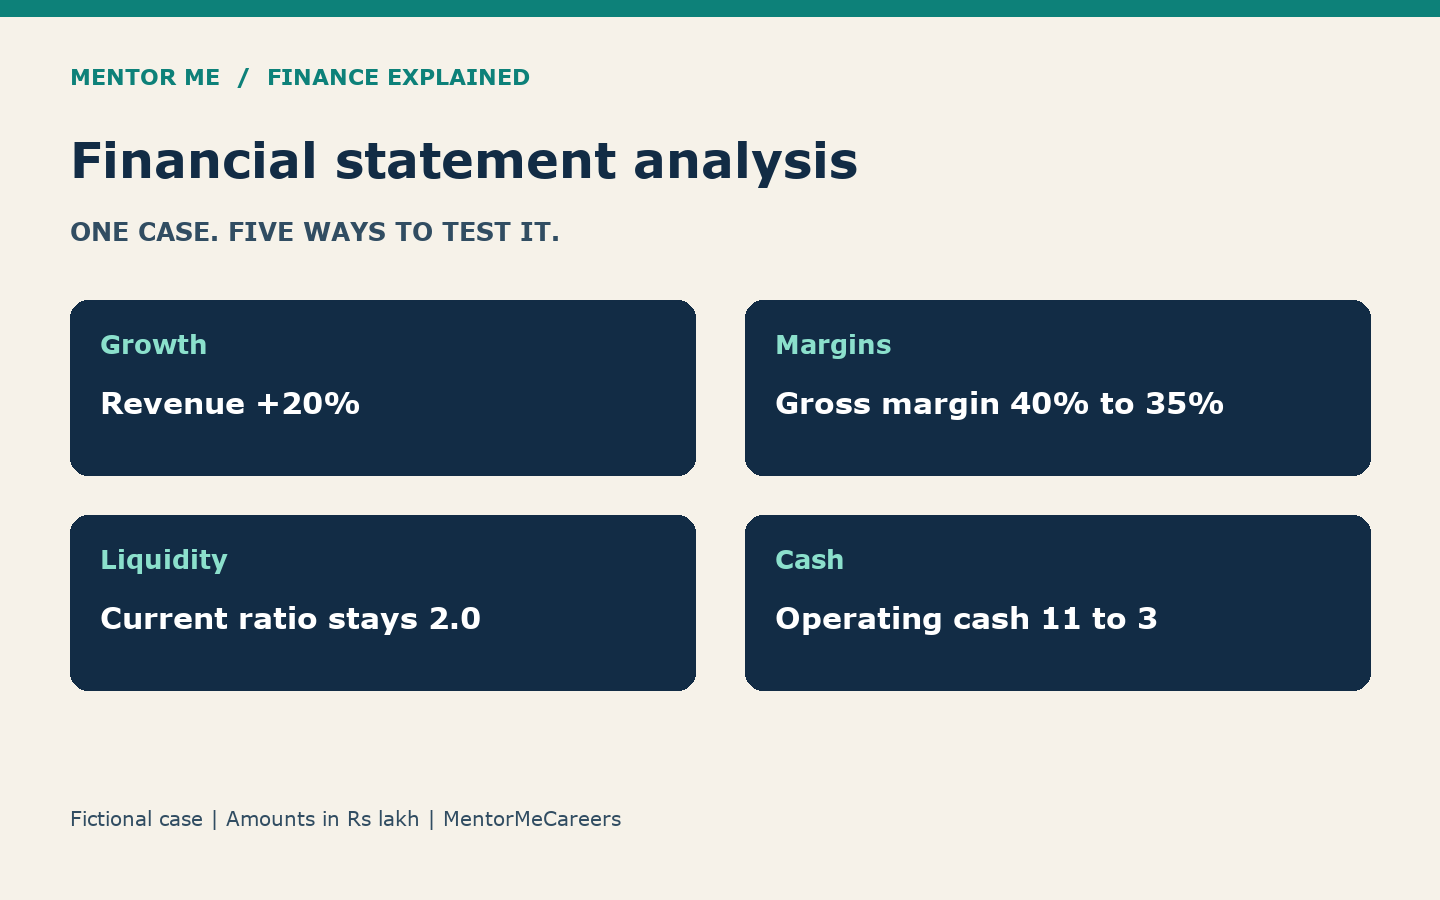
Operating cash flow divided by net profit falls from 11 ÷ 9 = 1.22 to 3 ÷ 7 = 0.43. In Year 2, the business collected far less operating cash than its net profit. That gap deserves a cash-flow bridge.
Receivables and inventory rose by ₹9 lakh and ₹6 lakh. Those changes can absorb cash. But the selected data do not include every payable, tax and non-cash movement. Therefore, do not claim that these two balances fully reconcile the drop in operating cash flow. Read the full statement and notes.
Also separate operating cash from financing cash. A new loan can lift the bank balance without improving customer collections. Read the operating cash-flow section before treating a larger bank balance as evidence of stronger customer collections.
Build these tools in Excel without hiding errors
- Put each reporting period in a separate column. Label the units and source page.
- Calculate changes from linked cells. For example, use =(C2-B2)/B2 when B2 is a valid non-zero base.
- Show “not meaningful” where the denominator is zero or the comparison misleads. Do not turn every error into 0%.
- Keep common-size ratios in a separate section. Use a fixed revenue reference for each year.
- Add a check that gross profit equals revenue less cost of goods sold.
- Write a short conclusion beside each result: observation, possible cause, evidence still needed.
Next, use the historical results to set forecast drivers. A margin decline should prompt a pricing or cost assumption, not an automatic repeat of last year’s growth. Our guide to building a financial model explains that next step.
What can make financial analysis misleading?
Check reporting dates, consolidation scope and accounting policies before comparing companies. A retailer and a software firm may hold very different levels of inventory. A business with large lease obligations may look different from one that owns its property. Read the notes before treating the ratios as directly comparable.
One-off gains can raise profit without raising normal earnings. Year-end collections can flatter a balance-sheet snapshot. Inflation can distort a long trend in nominal sales. Use sector context and more than one period. The tools of financial statement analysis cannot supply missing judgement.
Questions readers ask about financial analysis
What are the five main tools of financial statement analysis?
A practical five-part set is comparative statements, common-size statements, trend analysis, ratio analysis and cash flow analysis. Some courses group trend analysis under horizontal analysis. The labels can vary; explain the calculation and purpose rather than relying on a fixed count.
What are the three basic tools of financial analysis?
A common starting set is horizontal analysis, vertical analysis and ratio analysis. Add cash flow analysis when you need to assess how profit converts into cash. Three tools can start a review, but they do not set a limit on the work.
Are Excel and Power BI financial analysis tools?
They are software tools. They help you calculate and present results. Common-size statements and ratio analysis are analytical methods. Choose the method first, then use the software to carry it out. A polished dashboard does not prove that the inputs are sound.
Which tool is best for a beginner?
Start with a two-year comparative income statement. Calculate revenue growth, gross margin and EBIT margin. Then inspect operating cash flow and the notes. This sequence links simple calculations to a useful business question.
Turn the calculations into an analyst’s conclusion
My conclusion on this case is cautious: sales grew, but gross-margin pressure and weaker cash conversion reduced the quality of that growth. I would request product margins, receivables ageing and a full cash-flow bridge before making a recommendation. That is the value of using the tools together.
To build these foundations into forecasting and valuation, explore our Financial Modelling course.
Sources and further reading
Method references: NCERT, Analysis of Financial Statements; CFA Institute, Financial Analysis Techniques; and Open University, Financial statement analysis and interpretation. The case, calculations and conclusions above are original teaching examples, not company results.

A CFA charterholder with hands-on experience across investment analysis and finance education. At MentorMeCareers, he writes and reviews content on CFA, financial modeling, and investment banking careers — grounded in real market data rather than generic advice, and shaped by what actually helps candidates and professionals succeed.