In this article I discuss in detail on the real meaning of measures of central tendency and dispersion, more geared towards the CFA Level 1 Quantitative methods subject.
Here’s an article on Measures of Dispersion tailored to the CFA Level 1 exam syllabus. The article covers all required components: basics, examples, strengths, weaknesses, and use cases — presented in a structured format suitable for exam preparation and practical understanding.
Measures of Central Tendency and Dispersion- Meaning?
Measures of dispersion indicate how much variability or spread exists in a data set. While central tendency (mean, median, mode) tells us where the data is centered, dispersion tells us how spread out the data points are around that central value.
Downloadable Resources & Full Tutorial
Key Measures of Dispersion
a. Range
- Definition: The difference between the maximum and minimum values.
- Formula:Range=Xmax−Xmin
- Example: If returns over 5 days are 2%, 4%, 3%, 6%, 1%, thenRange=6%−1%=5%
b. Mean Absolute Deviation (MAD)
- Definition: The average of the absolute deviations from the mean.
- Formula:MAD=1n∑i=1n∣Xi−Xˉ∣
- Use: Simpler alternative to standard deviation; used when you want a basic sense of variability.
c. Variance
- Definition: The average of the squared deviations from the mean.
- Formula:σ2=1n∑i=1n(Xi−Xˉ)2
- Units: Squared units of the original data.
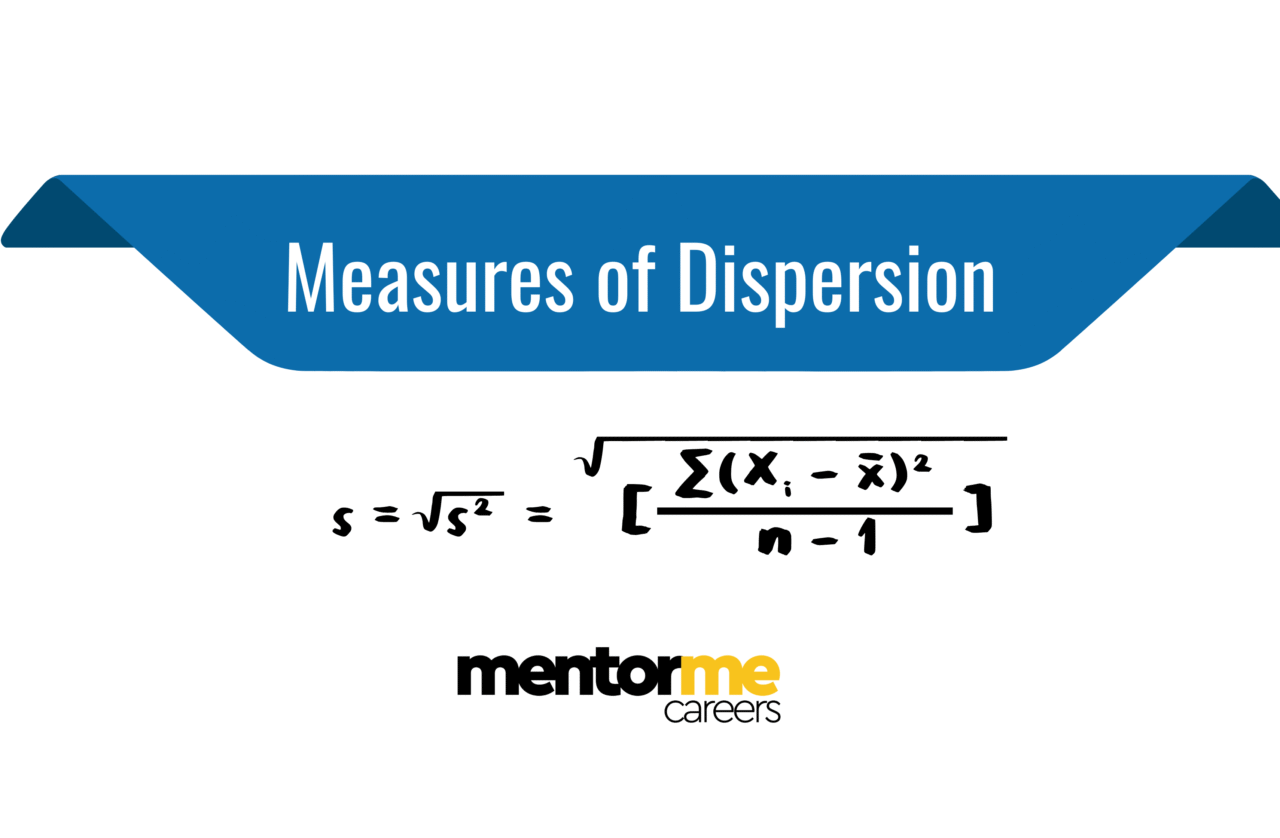
d. Standard Deviation
- Definition: The square root of variance; most commonly used dispersion measure in finance.
- Formula:σ=1n∑i=1n(Xi−Xˉ)2
- Interpretation: Expressed in the same units as the original data; shows typical deviation from the mean.
e. Semi-variance
- Definition: Measures dispersion of values that fall below the mean only.
- Use: More appropriate when focusing on downside risk.
f. Chebyshev’s Inequality
- Concept: Regardless of distribution, at least (1−1/k2) of the observations lie within k standard deviations of the mean.
- Example: For k=2, at least 75% of values lie within ±2σ of the mean.
Strengths and Weaknesses
| Measure | Strengths | Weaknesses |
|---|---|---|
| Range | Simple to compute | Sensitive to outliers, ignores all but two values |
| MAD | Easy to interpret, less sensitive to outliers than σ | Not used in many statistical procedures |
| Variance | Used in theoretical models | Units are squared, less intuitive |
| Standard Deviation | Widely accepted, intuitive interpretation | Assumes normality, sensitive to extreme values |
| Semi-variance | Focuses on downside risk | Ignores positive volatility (can be biased for total risk) |
Practical Use Cases in Finance
| Use Case | Preferred Measure | Reason |
|---|---|---|
| Risk assessment of portfolios | Standard deviation | Indicates total volatility |
| Downside risk (e.g., VaR, CVaR) | Semi-variance | Focus on losses rather than all fluctuations |
| Comparing investment consistency | MAD or standard deviation | Helps identify stable vs. volatile investments |
| Initial exploratory data analysis | Range | Quick check for spread and outliers |
CFA Level 1 Focus
The CFA Level 1 exam expects you to:
- Know formulas for variance, standard deviation, and MAD.
- Interpret standard deviation and its relation to risk.
- Apply Chebyshev’s Inequality in non-normal distributions.
- Use coefficient of variation (CV) to compare relative risk:CV=σXˉ
Summary
| Concept | Key Point |
|---|---|
| Dispersion | Measures the spread of data around the mean |
| Standard Dev. | Most common; used in risk and return analysis |
| MAD | Simpler, less sensitive to outliers |
| Semi-variance | Highlights downside risk |
| Chebyshev’s | Works for any distribution |
7. Example CFA-Style Question
Q: An analyst observes the following returns over five periods: 3%, -2%, 4%, 1%, and 0%. What is the standard deviation of returns?
Step 1: Calculate the mean:Xˉ=3+(−2)+4+1+05=1.2%
Step 2: Compute squared deviations and average:σ=(3−1.2)2+(−2−1.2)2+(4−1.2)2+(1−1.2)2+(0−1.2)25≈2.23%
Conclusion
Measures of dispersion are foundational for risk analysis and comparison of investment opportunities. CFA Level 1 candidates must understand both the mathematical formulas and practical implications of these measures in portfolio construction, risk assessment, and performance evaluation.
