Last updated on October 23rd, 2024 at 03:58 pm

Author: Sarthak Bhalerao
Table of Contents
What is Vertical Analysis?
Vertical analysis is an accounting tool that enables proportional analysis of financial statements. While performing a vertical analysis, every line item on a financial statement is entered as a percentage of another item. For example, on an income statement, every line item is stated in terms of the percentage of gross sales. Similarly, on a balance sheet, every entry is made not in terms of absolute currency but as a percentage of the total assets. This helps in representing every cash outflow or inflow relative to its total cash inflows.
Working on Vertical analysis
The vertical analysis makes it easier to compare the financial statements of one company with another. This is because one can see the relative proportions of the account balances. Vertical analysis is used within a financial statement for a single reporting period. The vertical analysis makes it easier to compare previous periods for time series analysis. Vertical analysis helps the accountant to ascertain the relative proportions of the balances of each account.
Enhanced Insights with Vertical Analysis: Base Figures, Trend Analysis, and Comparisons
Vertical analysis is a powerful accounting technique that allows for a detailed proportional analysis of financial statements by expressing each line item as a percentage of a base figure. On an income statement, this base figure is typically total revenue or gross sales, while on a balance sheet, it’s total assets. For example, when analyzing the cost of goods sold (COGS), it would be shown as a percentage of total sales, providing clear insights into the proportion of revenue consumed by production costs. Similarly, on a cash flow statement, vertical analysis can illustrate each cash flow item as a percentage of total cash flows, helping to evaluate how different cash sources and uses impact overall liquidity.
Vertical analysis also facilitates trend analysis by enabling comparisons over time. This method simplifies tracking changes in financial metrics and understanding their implications relative to the base figure. For instance, if a company’s cost of goods sold increases from 40% to 45% of sales over consecutive periods, this trend can signal rising costs or pricing pressures. Comparing vertical analysis with horizontal analysis, which examines financial statement data across multiple periods to detect trends, helps provide a fuller picture. Vertical analysis highlights the relative proportion of each item in a single period, while horizontal analysis tracks changes over time, offering a complementary perspective on financial performance.
Advantages of Vertical Analysis
- Vertical analysis simplifies the correlation between single items on a balance sheet and the bottom line, as they are expressed in a percentage. The company’s management can use these percentages to set goals and threshold limits. For example, the management may consider shutting down a particular unit if the profit per unit falls below a particular threshold percentage.
- Vertical analysis is a more potent tool than horizontal analysis.
- Vertical analysis is also very useful in comparing a company’s financial statements to the trends in the industry.
- It is highly effective when comparing two or more companies operating in the same industry but having different market capitalizations. It is often very tricky to compare the balance sheets of a company that is valued at 1 billion dollars with a company that is valued at $500,000. The vertical analysis enables accountants to create common size measures that enable them to compare and contrast amounts of different magnitude in a very efficient manner.
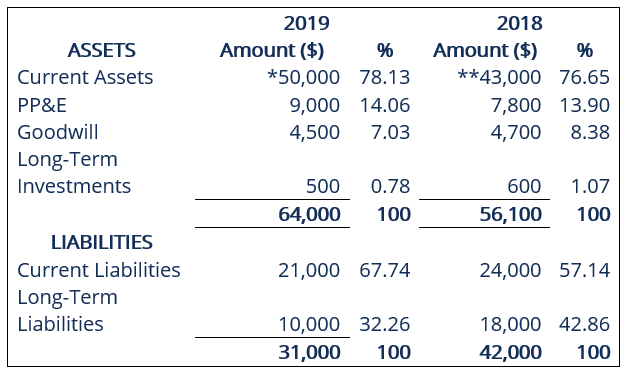
A comparative Balance sheet with Vertical Analysis